OEE Improvement

Your OEE tells you where the loss shows up. Not what is keeping it there.

The score points at a factor. The hours behind it sit in downtime that waited, stops nobody logged, and defects caught too late. We help you find them, price them, and close them.

From score to recovered capacity
1

An OEE result

One number that says a factor is down.

2

Hidden operational losses

Waiting, micro-stops and missed defects the report never names.

3

Coordinated action

The right person gets the right task with the right context.

4

Recovered capacity

Hours back, and a plan that learns from what worked.

Frost & Sullivan 2026 Best Practices Recognition
Global Company of the Year, Augmented Connected Worker, End-to-End Platforms.
Newmont GRACE Kimberly-Clark Chobani Westlake Indorama Ventures
The real problem

The number is not the loss

Your OEE tells you where the loss appears.
It does not tell you what is keeping it there.

A stop that waited
The line was down for two hours, but the crew waited most of it on a part that was never staged.
A slow cycle nobody logged
The line ran under rate all shift. The micro-stops were too short to log, so they never reached the plan.
A defect caught too late
The abnormality was visible early, but the corrective action landed after the batch had already run.
A finding that sat
An operator flagged the issue on a round. It sat uncoded until it became a breakdown weeks later.
Interactive

Where is your OEE leaking?

See what the report shows for each factor, what is usually underneath it, and what changes when execution is connected.
Availability

Availability

Downtime, delayed maintenance, parts not ready
What you see

The line is down and the fix is already late. Availability takes the blame first because everyone watches it.

What is usually underneath

The work order waited. Parts were not staged, the permit was not ready, or a finding sat uncoded until it became a breakdown.

What changes when execution is connected

The loss becomes a work order the moment it is seen, with parts and permit attached, so the crew mobilises to a job that is ready.

performance

Performance

Slow cycles, micro-stops, handoff gaps
What you see

The line runs, but under rate. Small stops and slow cycles rarely halt production long enough to get logged.

What is usually underneath

The operator handoff dropped the context. The same micro-stop recurs because nobody captured it where the next shift or the planner could act.

What changes when execution is connected

Every stop is captured where it happens and fed back into the plan, so the recurring loss stops recurring.

quality

Quality

Missed abnormalities, late corrective action
What you see

Scrap and rework climb, and the corrective action lands after the batch is already gone.

What is usually underneath

The abnormality was missed or the inspection was inconsistent, so the defect travelled downstream before anyone acted.

What changes when execution is connected

Defects are caught at the source and routed to the right person with context, so the corrective action happens while it still matters.

See what these gaps could mean for your plant.

Book a Margin Walkthrough
Why programmes stall

Why OEE improvement programmes stall

The score can improve for a quarter and then slip back. Three operational gaps are usually why.

01

Losses are not captured consistently

The Pareto only sees the losses people had time or reason to code. The biggest hours are never named, so the plan targets the wrong thing.

02

The insight does not reach the person who can act

The dashboard flags the issue, but the operator, technician or planner still works through disconnected processes to do anything about it.

03

The action is not connected back to the result

The plant fixes something, but nobody confirms whether the fix actually removed the loss. So it returns, and the score slips again.

Free guide

Turn OEE losses into recovered capacity.

A practical guide to finding hidden availability, performance and quality losses and connecting every fix back to the result.

Download the OEE Improvement Guide
The operating model

From an OEE signal to recovered capacity

Leading plants do not chase the score. They close the loop from the loss to the verified fix.

01

Detect

See the loss as it happens, coded at the moment it occurs, not reconstructed at month end.

02

Contextualize

Connect machine, operator, asset, work order, parts and history, so the loss has a cause, not just a number.

03

Act

Get the right person the right task with the right context, and execute it, offline where needed.

04

Verify

Measure whether the intervention actually removed the loss, and feed the result back into the plan.

How Innovapptive helps

How Innovapptive eliminates OEE leaks

One execution platform on top of SAP, IBM Maximo and Oracle EAM. It protects throughput, restores reliability, and digitises every workflow, with no rip and replace.

OEE Tracker

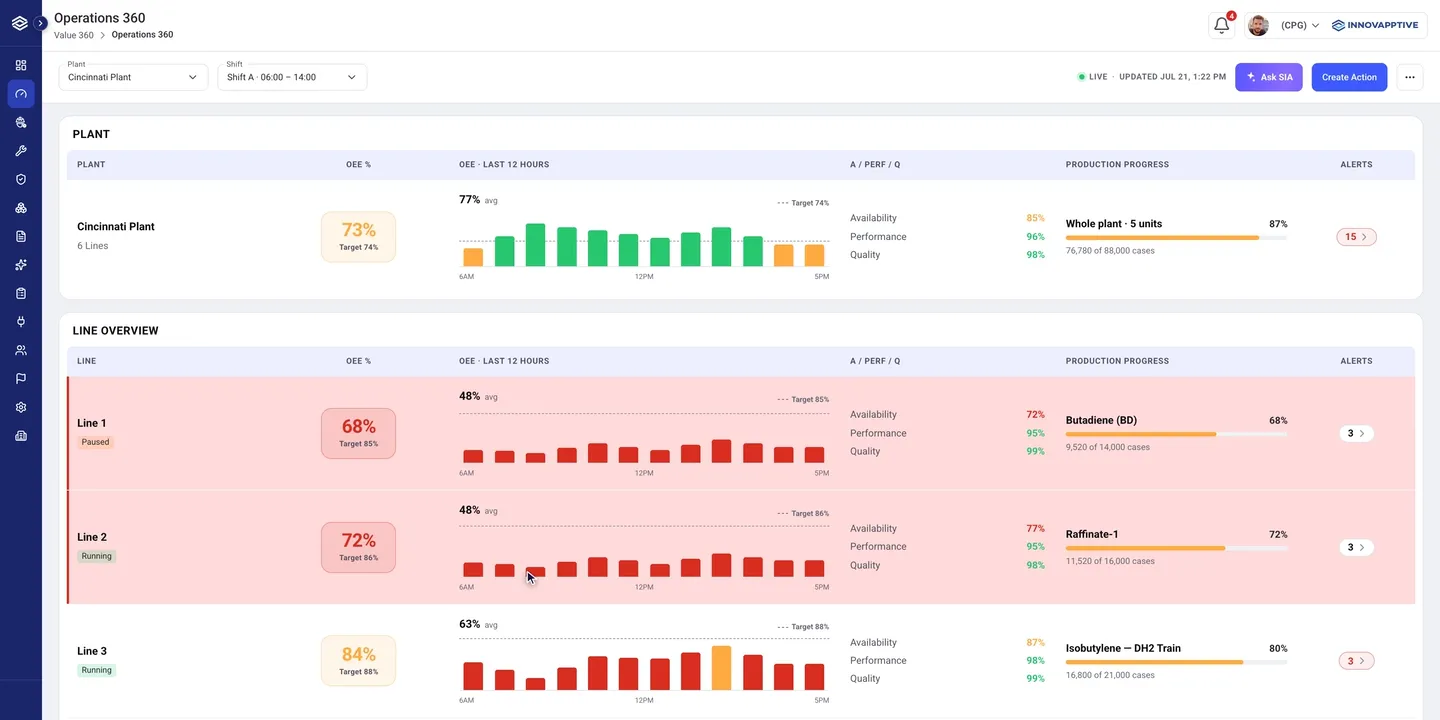
Live OEE, line by line

OEE Tracker shows availability, performance and quality for every line as it runs. Each stop, slow cycle and reject is captured with its reason at the source, not pieced together at shift end.

  • See which factor is costing you OEE on each line, right now.
  • Turn any loss into a round, a work order or a root cause analysis in one tap.
See it in a Margin Walkthrough
idms-10-oee-tracker
Smart Trigger

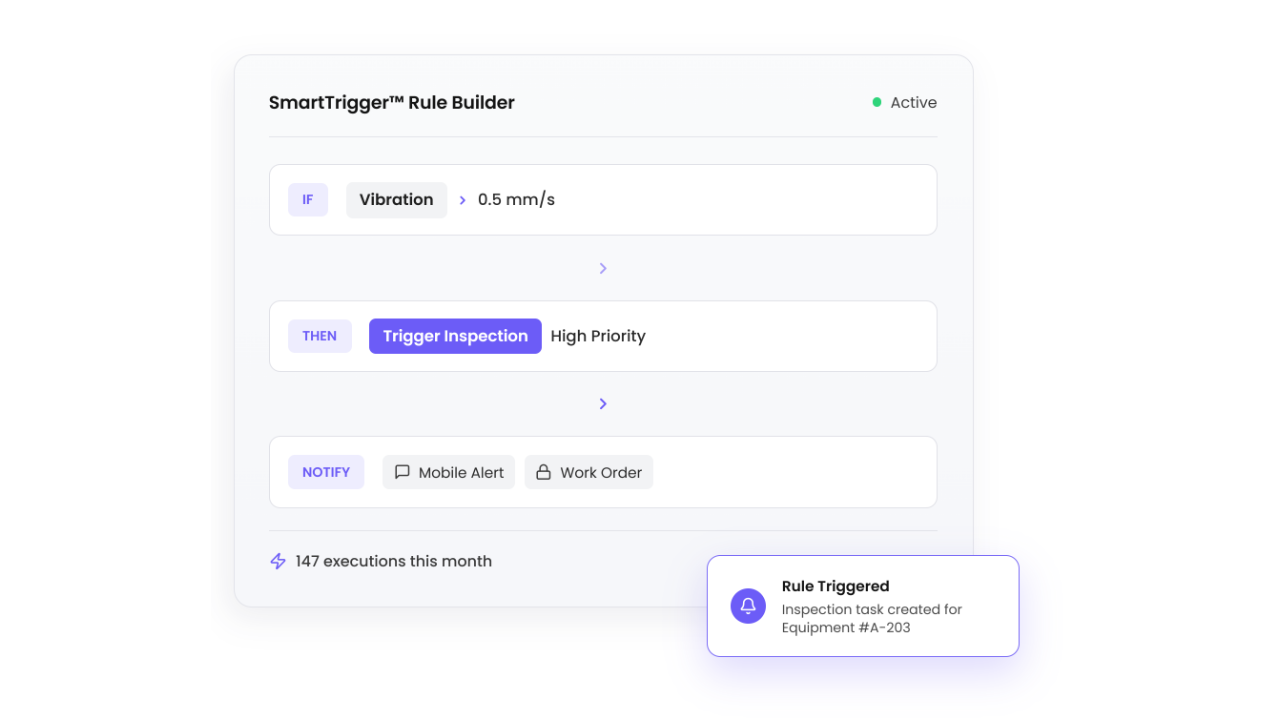
Act on machine signals the moment they change

Smart Trigger connects to your MES, APM, historians, SCADA and ERP. When a signal crosses its limit, it launches the right inspection or work order automatically, so a person checks the asset before it stops.

  • Breakdowns are caught while they are still small fixes.
  • Signals your systems already have finally lead to action on the floor.
See it in a Margin Walkthrough
SmartTrigger-1280x720
Quality Management

Catch quality deviations before they become scrap

Quality mapping links each product spec to the process and equipment conditions that drive it. AI anomaly detection watches those conditions during inspections and flags deviations the human eye misses, with the likely cause.

  • Deviations are caught in process, before rework and startup rejects.
  • Every alert points to the step or asset behind it, so the fix is fast.
See it in a Margin Walkthrough
Quality-Deviations-1280x720
AI Root Cause Analysis

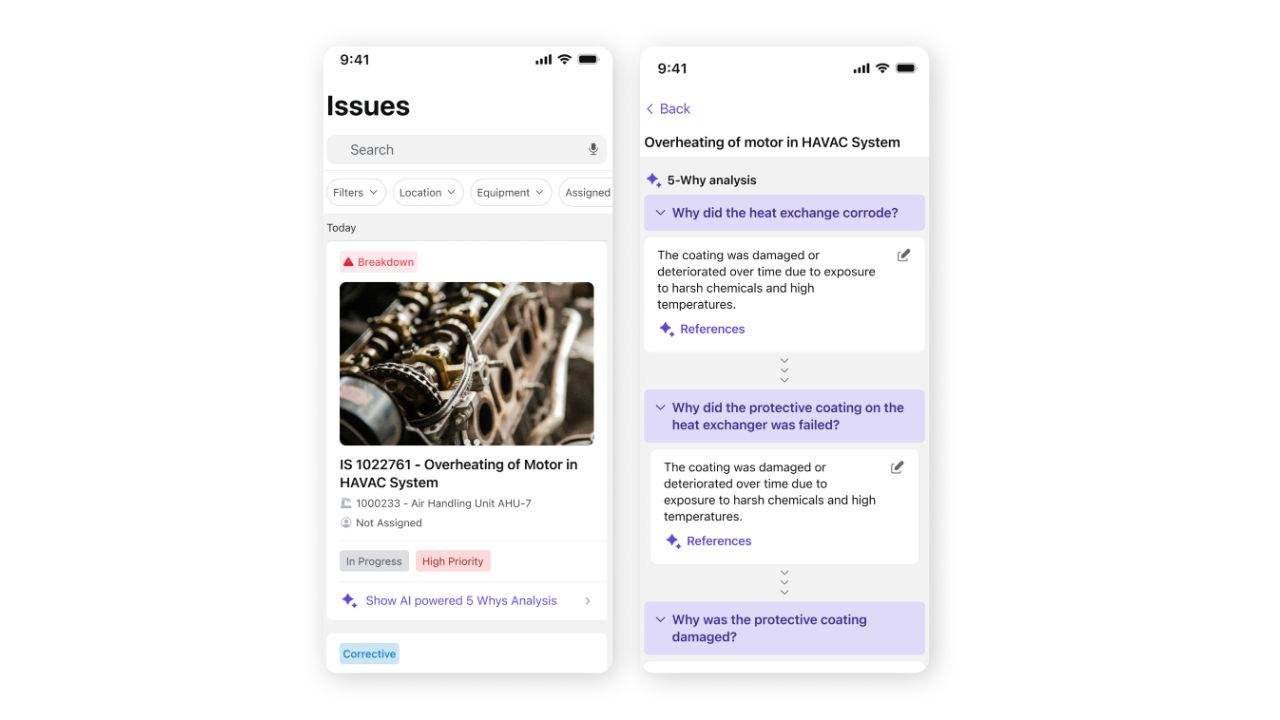
Stop the same failure from coming back

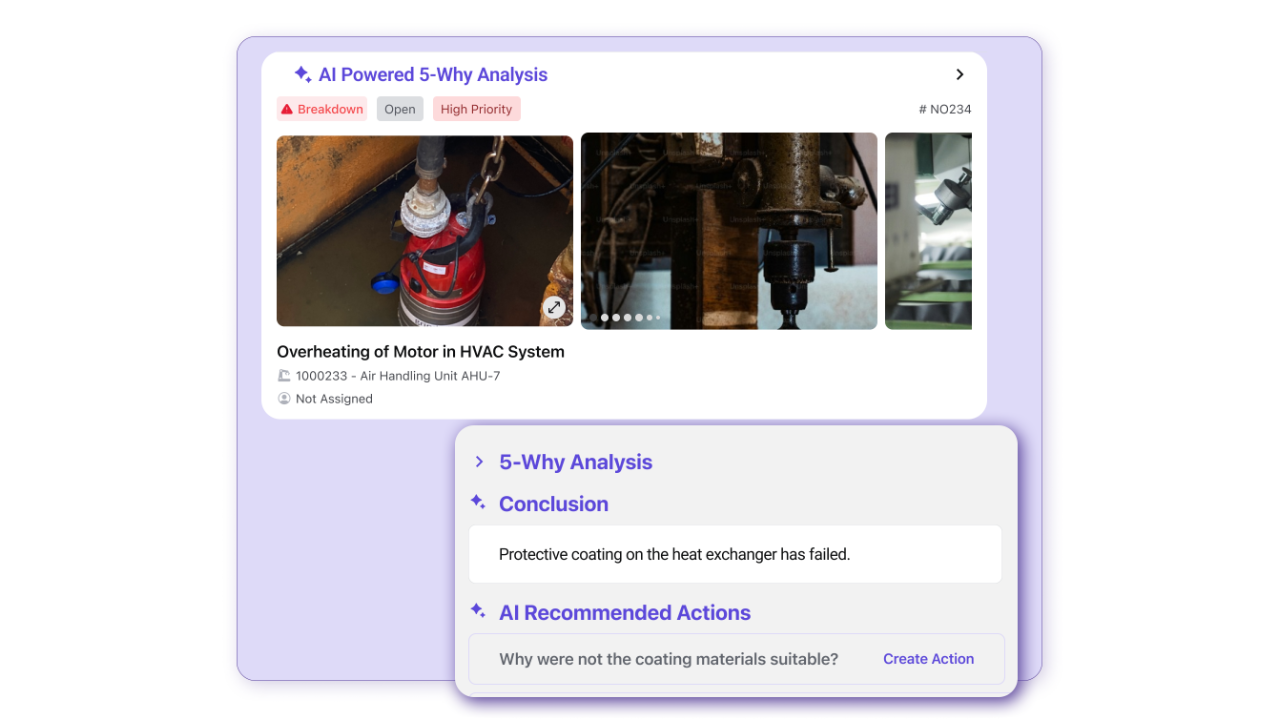
Repeat failures drain availability quietly. AI Root Cause Analysis groups recurring failures across assets and shifts, suggests likely causes and guides your team through a 5-Why.

  • Countermeasures become tracked work, not meeting notes.
  • The loop closes only when the fix has held.
See it in a Margin Walkthrough
Root-Cause-Analysis-1280x720
Closed-Loop Execution

From OEE loss to lasting fix, across every team

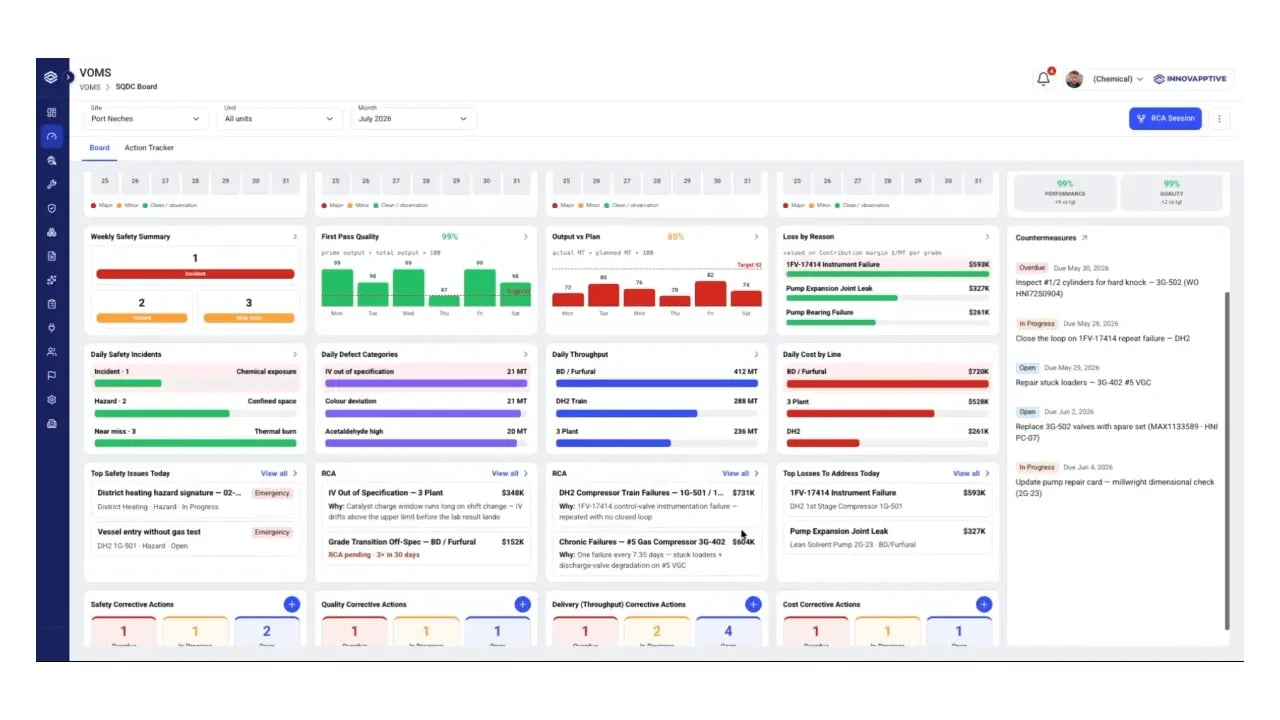
Seeing a loss doesn't move OEE. Fixing it does. Innovapptive connects operations, maintenance, permits, planning and continuous improvement, so every loss moves through each team on one linked record until the fix is verified.

  • Operators raise it, planners schedule it, permits clear it and technicians fix it.
  • SQDC dashboards keep every open loss in front of daily tier meetings until it's closed.
See it in a Margin Walkthrough
SQDC-Board
Customer proof

What happened when execution was connected at Indorama

Innovapptive connected frontline execution to the systems already in place, digitised paper work orders, and closed the reactive gap, without adding headcount.

Digital transformation works when it’s driven from the frontline—giving operators the power to improve execution and protect margin.
Mark Holden Mark Holden Chief Manufacturing and Technology Officer Indorama Ventures
$19M
realised EBITDA savings in 2025
58%
maintenance backlog cut, 24 weeks to 10
80%
PM to CM ratio, up from below 50%
140 → 83
contractors, without losing capacity

See how the site got there, step by step.

Read the Indorama story
The next step

See what a Margin Walkthrough can uncover

A two-day diagnostic that finds your OEE hours, prices them, and hands you the priorities. The report is yours to keep.

1

Understand

We review your data and operating context, on top of the systems you already run.

2

Observe

Two days on your floor, tracing where time, work and decisions are being lost.

3

Quantify

We put a defensible financial value against the gaps we find, from your own numbers.

4

Prioritize

You leave with the opportunities and actions that matter most, ranked by return.

Analyst Recognition

Recognized as a Leader in Connected Worker Platforms

Frost & Sullivan named Innovapptive 2026 Company of the Year and a Leader in its Frost Radar™ for Augmented Connected Worker, End-to-End Platforms, based on platform breadth, AI execution capability, and measurable customer impact.

Frost & Sullivan 2026 Company of the Year award badge — Innovapptive Connected Worker Platform
Frost & Sullivan Best Practices

2026 Company of the Year,
Global Connected Worker Platforms

Frost & Sullivan recognized Innovapptive for closing the frontline execution gap with its end-to-end connected worker platform.

Get the Report
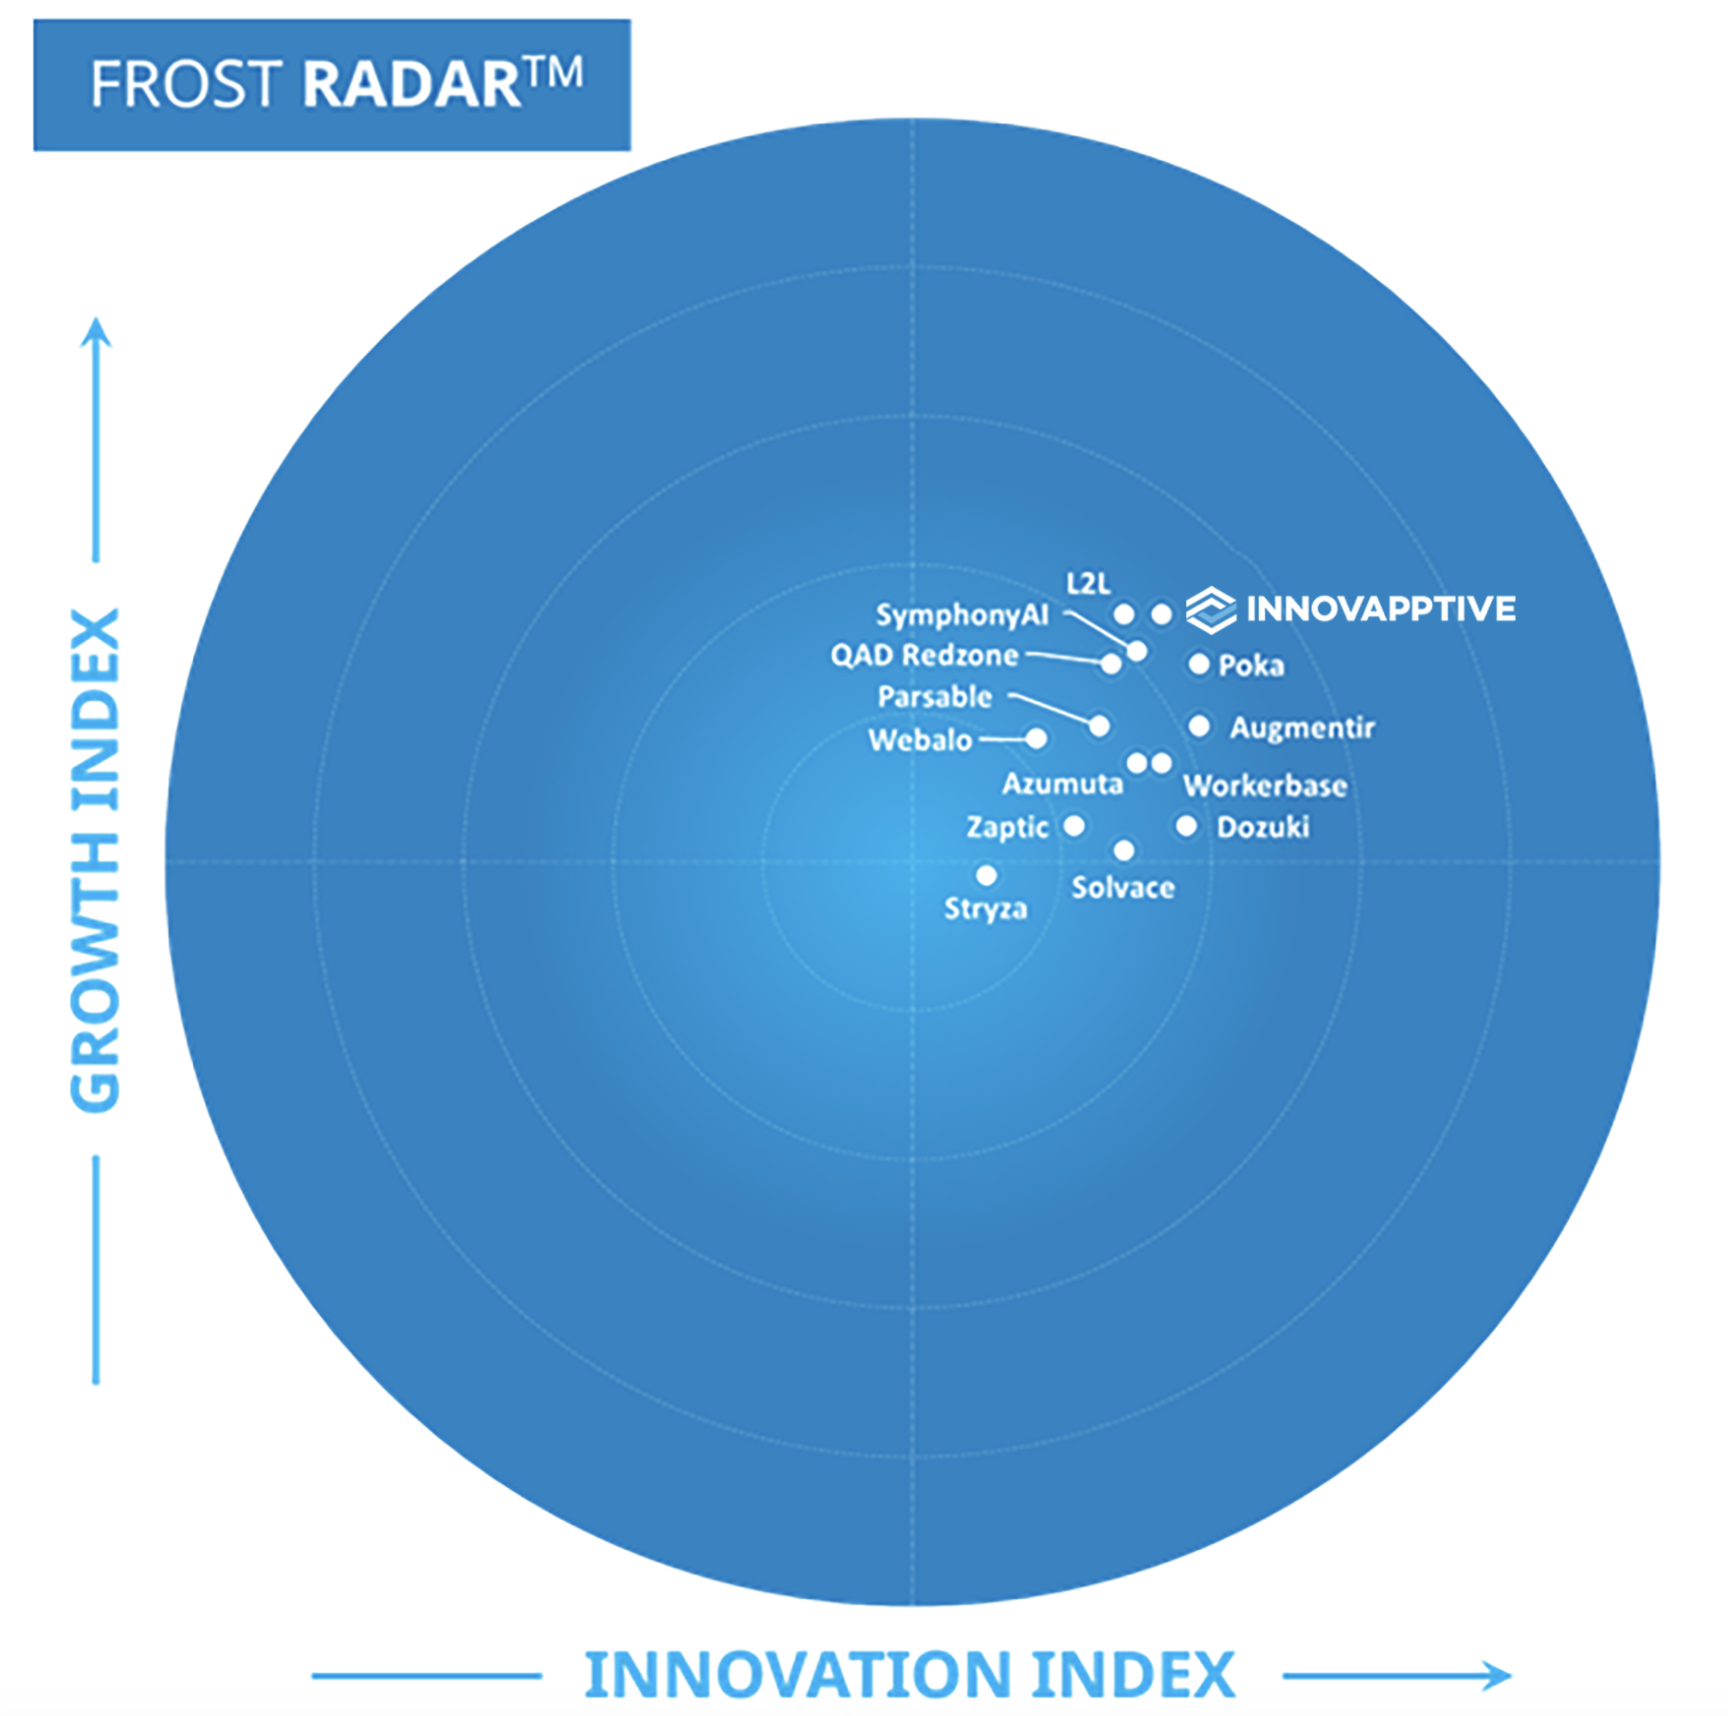
Frost Radar 2025 — Innovapptive positioned as a Leader in connected worker platforms
Frost Radar™ 2025

A Leader in Augmented
Connected Worker Platforms

Positioned as a Leader for connected worker platforms based on innovation, growth performance & proven enterprise scalability.

Get the Report
“Innovapptive has taken an innovative approach to AI, developing one of the most extensive AI agent portfolios available. These agents assist manufacturers with their maintenance, operations, reliability, safety, and analytics needs.”
Juan Francisco Dell'Era · Senior Research Analyst, Industrial Automation & Software, Frost & Sullivan

See where your OEE points are really going

Book the walkthrough, or start with the sample report.

Also Explore

Improve TPM

Know More

Reduce Maintenance Cost

Know More

Improve Wrench Time

Know More
Common questions

Questions we hear from plant leaders

The score can move while the expensive hours stay uncounted. Overtime, contractors and waiting between roles rarely show up in the OEE report, so cost climbs even as the number improves.

A dashboard shows the loss. It does not capture the losses nobody coded, route the fix to the right person, or confirm the fix worked. Innovapptive closes that loop back into your system of record.

No. Innovapptive runs on top of your system of record and posts confirmations back to it. Indorama ran both SAP PM and Maximo and kept them.

It is complimentary, and the report is yours whether or not you take it further. Your only input is about four hours of data and two days on site.