Maintenance cost reduction

Reduce maintenance costs by fixing what makes work reactive.

Overtime, contractor call-outs and emergency parts orders show up in your budget. The causes do not. Jobs wait for parts and permits, failures come back, and planned work turns into rush work.
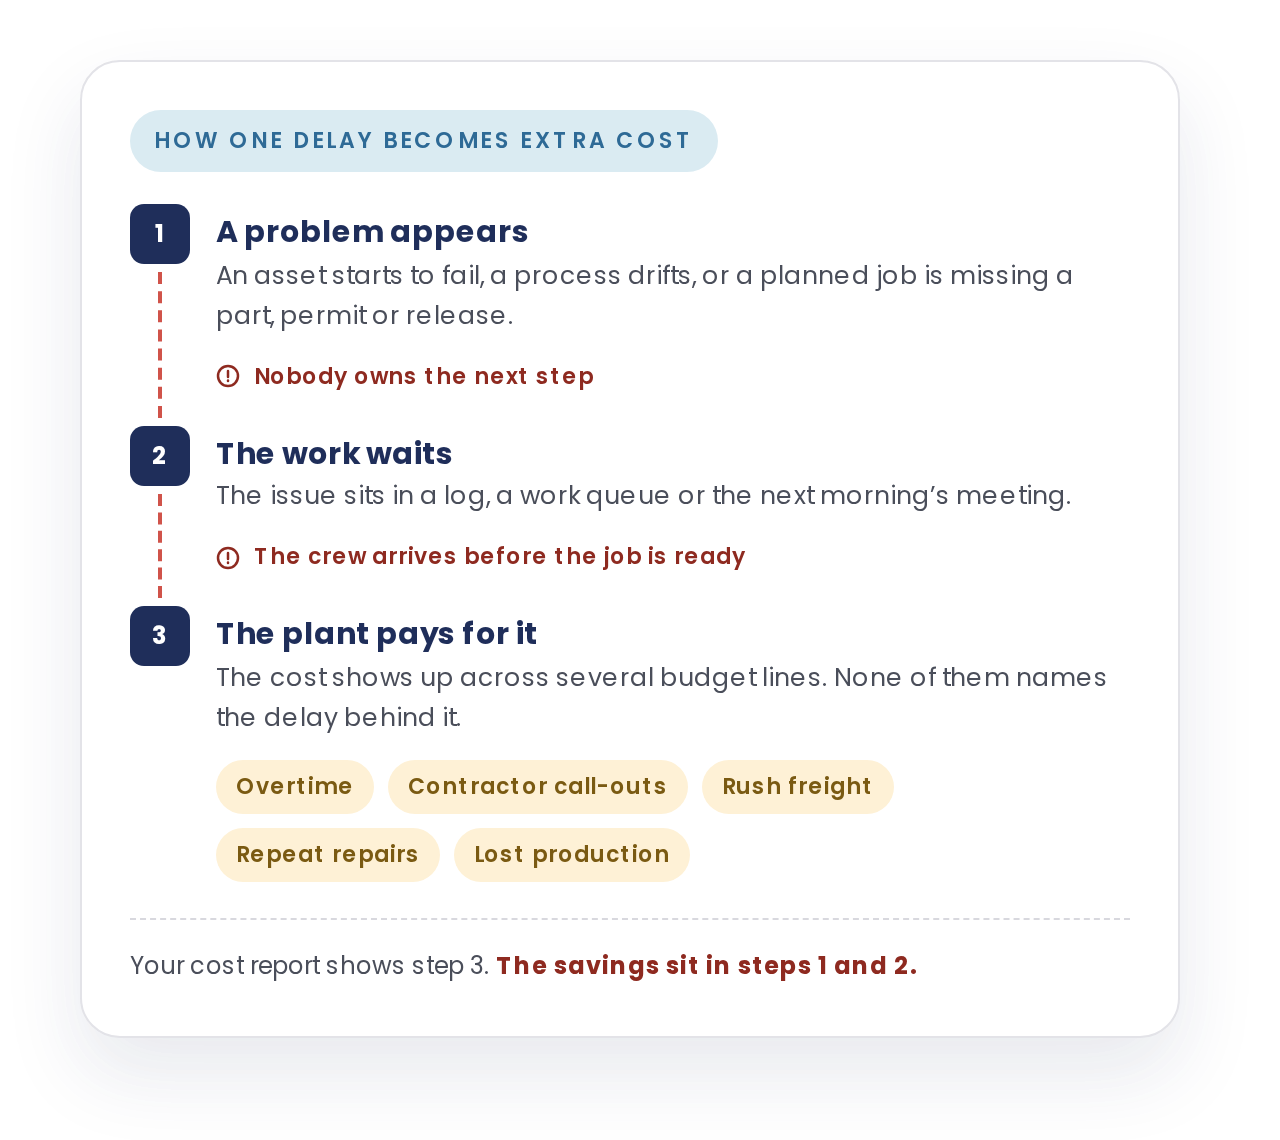

maintenance-cost-delay
Frost & Sullivan 2026 Best Practices Recognition
Global Company of the Year, Augmented Connected Worker, End-to-End Platforms.
Newmont GRACE Kimberly-Clark Chobani Westlake Indorama Ventures
The real cost problem

Your cost report shows what you spent.
Not why you spent it.

A monthly report can show that overtime went up or freight costs spiked. It cannot show the delay, missing part or repeat failure that caused it.

What your systems record

What was spent

  • Labor, contractor and overtime hours
  • Corrective work orders and failure codes
  • Purchase orders, stock levels and freight charges
  • Downtime, recorded after it happened
What happens on the floor

Why it was spent

  • How long a known problem waited for a decision
  • Whether the job had its parts, permit and instructions
  • Why the same failure came back after the job closed
  • Whether the part in the system was actually on the shelf

The cost shows up in the budget. The cause sits on the plant floor.

Budget cuts lower the number for a quarter or two. Fixing the cause keeps it down.

Interactive cost diagnostic

Where is your maintenance spend going?

Pick a cost area. See what a cost report can show, then compare it with the operational evidence behind the spend.

What your cost report shows

Material variance reported

Month-end figures show material use above standard and some yield loss.

  • Total consumption is recorded
  • Yield loss is booked to production
  • The cause is not named
What the floor can reveal

Hours run off target

The useful test is how long a known drift ran before someone corrected it.

  • When was the drift first seen?
  • When did corrective work start?
  • How much product was made in between?
Every hour a problem waits is an hour of product made at the wrong cost.
Ask how long your units run off target before someone acts.
Book a Margin Walkthrough
What your cost report shows

Utility bill by area

Power, steam, air and cooling are totalled by month and allocated by area.

  • Consumption is metered
  • Cost is allocated by area
  • Equipment condition is not shown
What the floor can reveal

Energy lost to condition

The stronger test is how much use ties back to equipment problems nobody fixed within the shift.

  • Use by area against equipment condition
  • Run status and production rate
  • When the problem was raised and when it was fixed
Your utility bill shows the energy you used. Not how much went to poorly running equipment.
This pool rarely shows up in a maintenance review, so it is easy to miss.
Book a Margin Walkthrough
What your cost report shows

Labor hours and rates

Overtime and contractor hours are booked against cost centres and work orders.

  • Hours are recorded
  • Rates are known
  • The reason for the overtime is not
What the floor can reveal

Repeat failures and waiting crews

The real test is how much of that labor went to repeat failures or to crews waiting for a ready job.

  • Planned versus reactive work orders
  • Repeat failures on the same asset
  • Why jobs waited or were rescheduled
The same job costs more when it is done as a breakdown.
Repeat failures and waiting crews turn planned work into overtime and contractor hours.
Book a Margin Walkthrough
What your cost report shows

Stock value on the books

The ledger shows how much is held, by storeroom and part.

  • Stock value is reported
  • Turns and ageing are tracked
  • Duplicates and doubt are not visible
What the floor can reveal

Stock held to cover doubt

The useful test is how much safety stock exists because the record cannot be trusted.

  • Cycle count and bin check differences
  • Duplicate part numbers
  • Stockouts on planned jobs
Stock grows to cover doubt, not demand.
Inventory cuts do not hold until the stock record can be trusted. See MRO inventory accuracy
Book a Margin Walkthrough
What your cost report shows

Rush orders and freight charges

Purchasing records show emergency buys and expedite fees.

  • The order is recorded
  • The freight cost is booked
  • The part the plant already owned is not
What the floor can reveal

Parts lost between record and job

The stronger test is whether the part was in stock but missing, misplaced or not set aside for the job.

  • Stock record against physical bin checks
  • Reservations against staged kits
  • Jobs delayed while waiting for parts
Rush freight is the visible cost. The extra stock bought afterwards stays on the books.
Most emergency buys trace back to a part the plant already owned.
Book a Margin Walkthrough
How the cost is created

One delay can turn into more than one expense.

Spotting a problem is not enough. What matters is how fast someone decides, gets the job ready, fixes it and stops it coming back.

01

A problem appears

An asset starts to fail, a process drifts, or a job is missing a part.

02

The decision waits

The right person does not see it, or nobody owns the next step.

03

The job is blocked

Parts, permits, instructions or equipment release are missing when the crew arrives.

04

You pay for it again

The fix happens at overtime rates, with contractors, rush freight or a repeat repair.

05

The lesson is lost

What the crew found never changes the next plan, so the failure comes back.

Savings you can stand behind

Count the savings that are real,
not just the biggest number.

A cost reduction case only helps if your finance team agrees with it. Four rules keep it credible.

Is it real cash?

Backlog is not savings

Open backlog is work you have not done yet. That money was never spent, so finishing the work saves nothing.

Where do we start?

Start from what you spent

Agree the time period, the type of work and today’s baseline before putting a value on anything.

What is assumed?

Show what was seen and what was estimated

Each saving names its cause, its owner, the expected change and what was left out.

Did it work?

Check the result afterwards

Measure the same number the same way after the change, so the saving can be proven.

Free guide

The Guide to Reduce Maintenance Cost

How to find the delays, repeat failures and blocked jobs behind your maintenance spend, and build a savings case your finance team will sign off.

Get the guide
What changes

Every problem gets an owner,
a ready job and a closed loop.

Costs fall when each problem reaches the right person, the job is ready before the crew arrives,
and the result improves the next plan.

01

Spot the problem early

Bring alerts, findings, work orders and parts status into one view.

02

Give it an owner

Make clear who acts next and what is blocking the job.

03

Send crews a ready job

Crews get the parts, permit and instructions, and record the work as they do it, even offline.

04

Feed the results back

Actual hours and findings return to planners and reliability engineers to improve the next plan.

How Innovapptive helps

How Innovapptive takes
cost out of maintenance

Maintenance cost hides in contractors, overtime, excess spares and work that waits. Innovapptive connects maintenance, inventory, planning and permits to take it out, on top of SAP, IBM Maximo and Oracle EAM. Customers typically remove $15M to $20M for every $100M of maintenance spend.

Mobile Maintenance

Do more with your own crews, and use fewer contractors

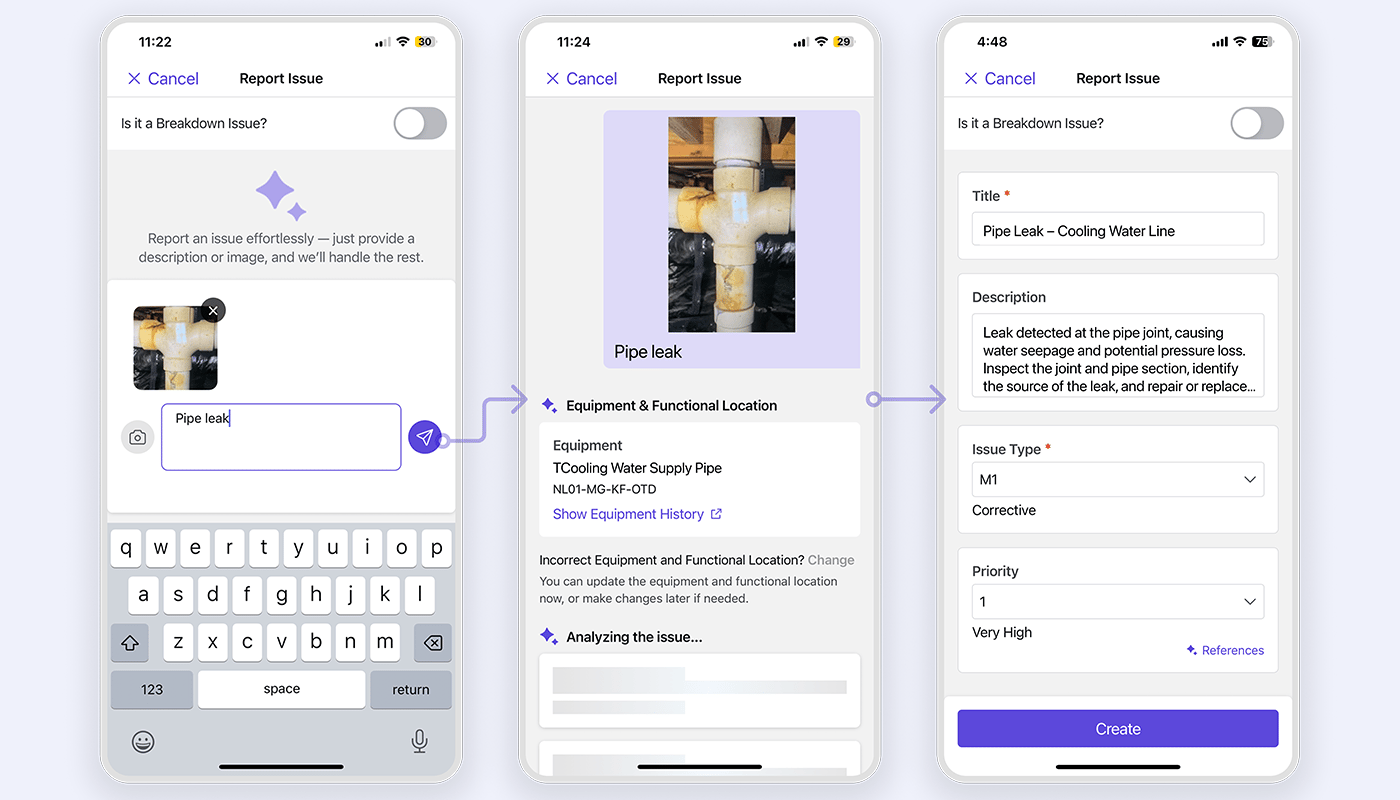
Mobile Maintenance gives every technician the complete job, history, parts and procedure on mobile. More productive internal crews cover more work, so contractor hours and overtime fall.

  • Less time on paperwork and travel, more time on the tools.
  • Contractor and overtime hours are tracked against plan.
See it in a Margin Walkthrough
Maintenance
Inventory & MRO Management

Free up working capital tied up in spares

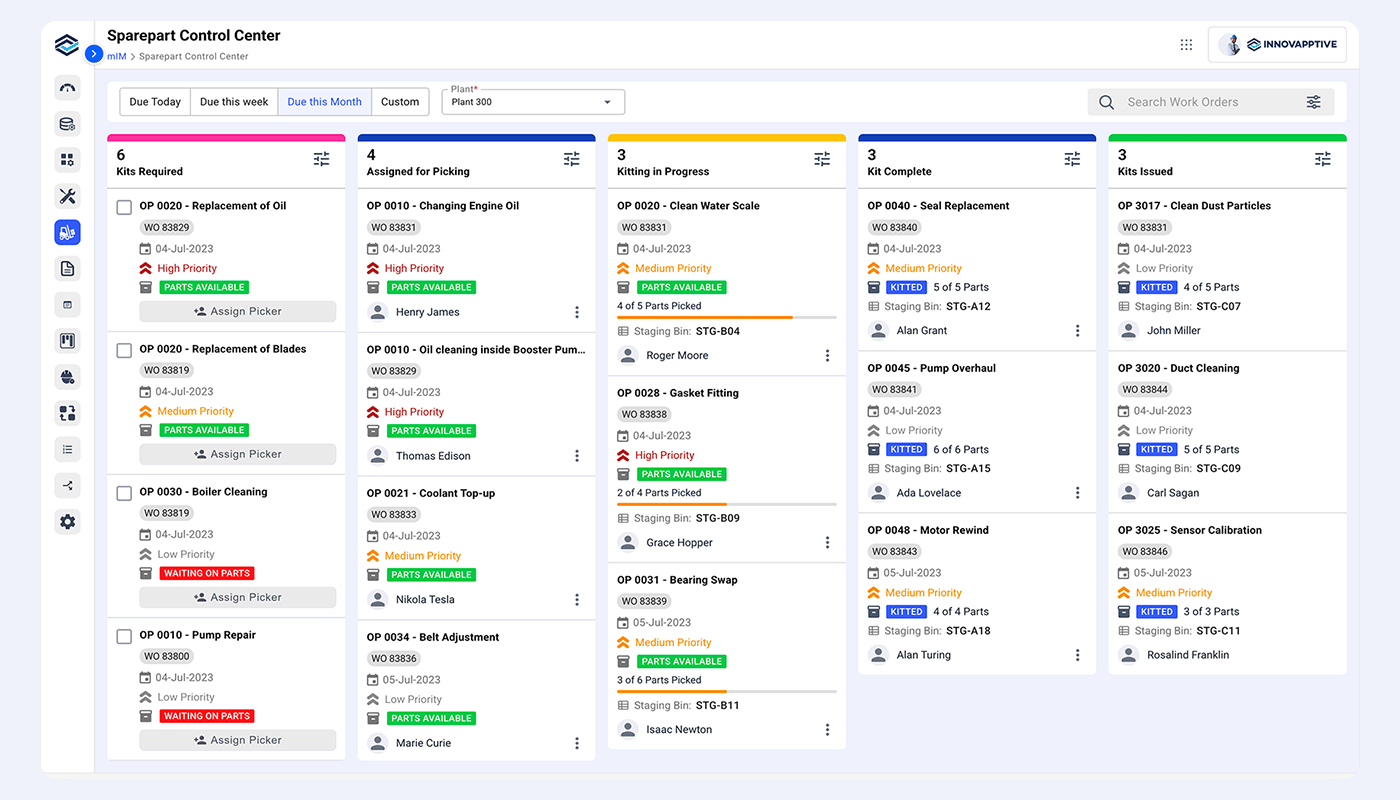
End-to-end inventory and MRO management gives one accurate view of stock across storerooms. You hold what you need and stop buying what you already have.

  • Cut excess, duplicate and obsolete MRO stock.
  • Avoid expedite fees and emergency purchases.
See it in a Margin Walkthrough
spcc-1
AI Planning & Scheduling

Plan by risk, schedule by readiness

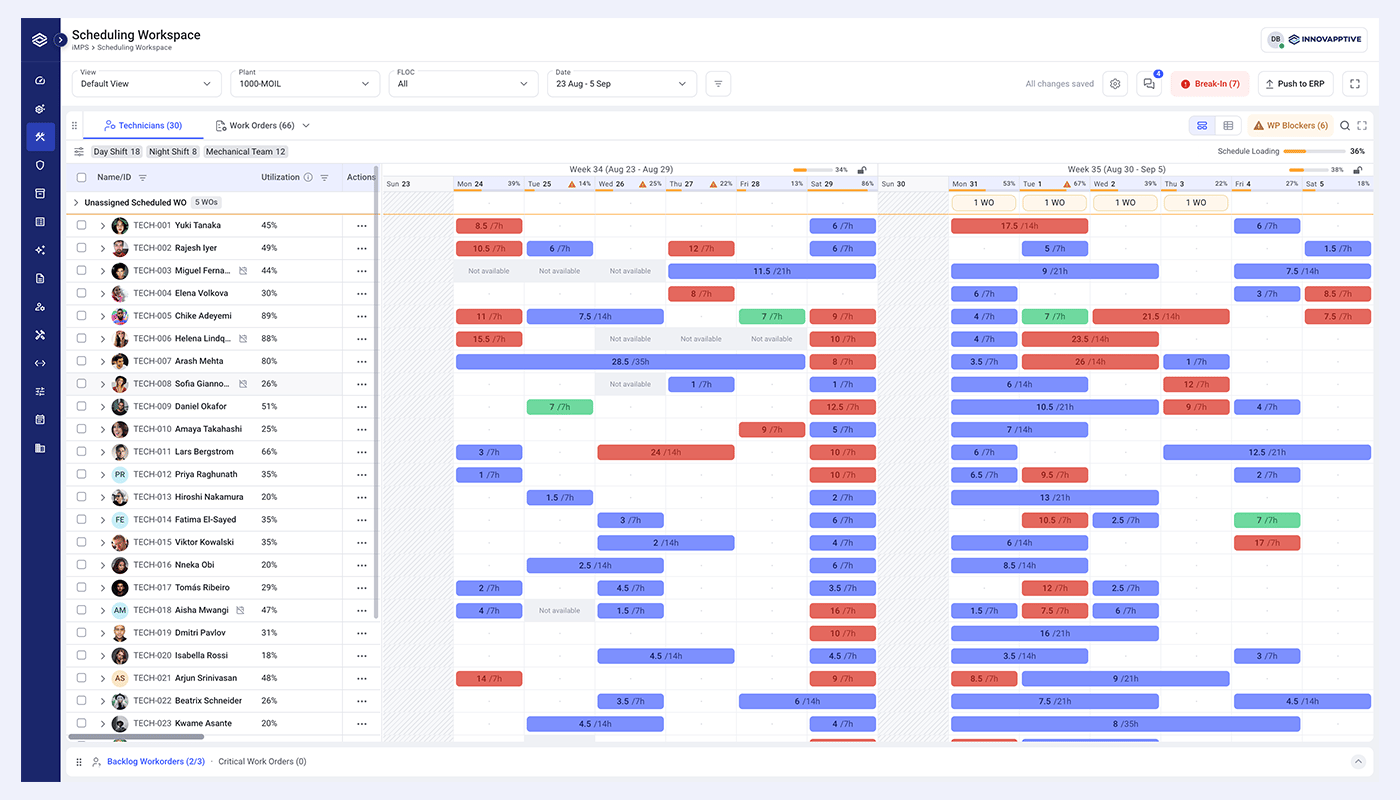
AI Planning & Scheduling ranks work by asset criticality and health. It sets PM intervals by condition instead of the calendar, and builds schedules your crews can actually complete.

  • Stop over-servicing healthy assets and free technician hours.
  • Clear duplicates and low-value work to shrink the backlog.
  • Schedule with drag and drop against real crew capacity.
See it in a Margin Walkthrough
innovapptive-imps-scheduling-workspace-ui-inline
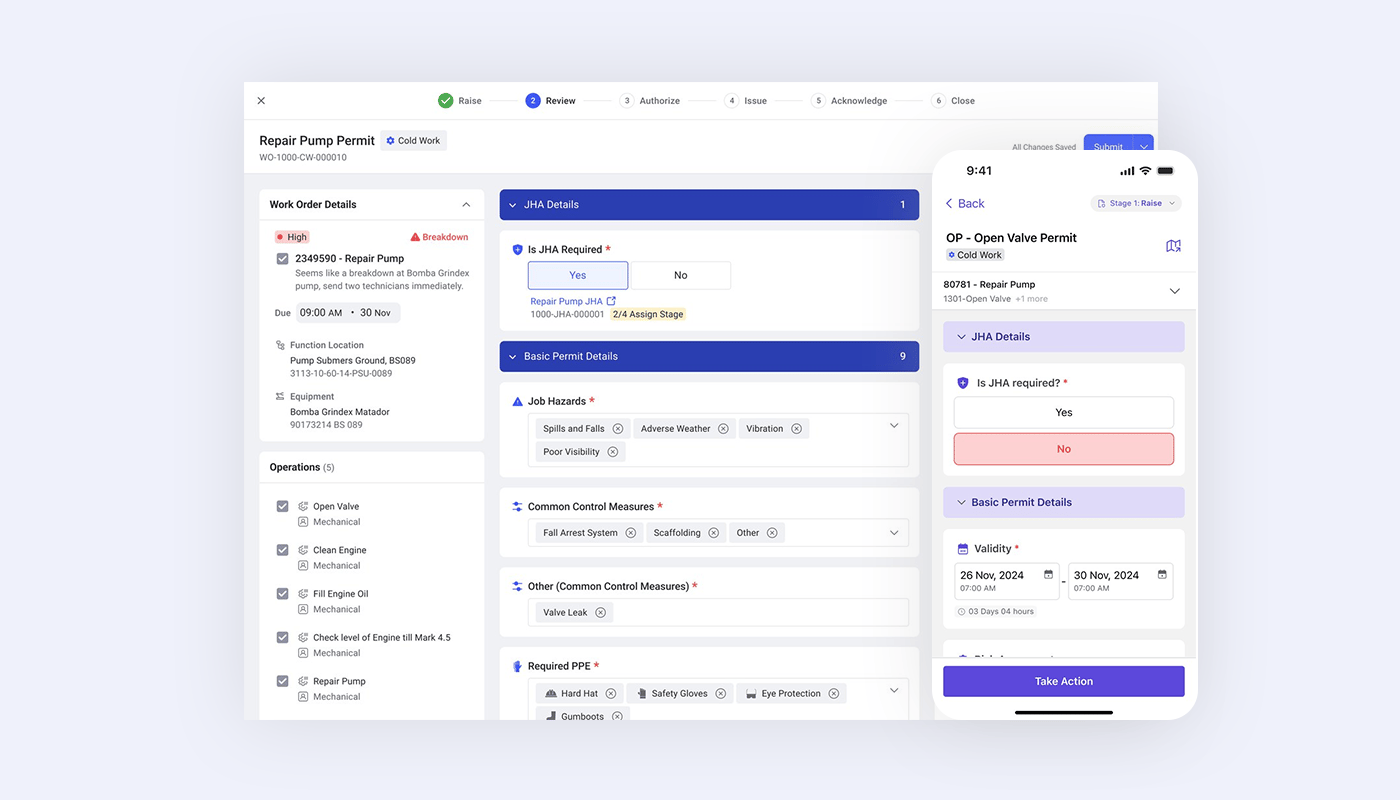
Integrated Permits

No job waits for parts or permits

Work is released only when parts are kitted and the permit is ready. Permits prepares hazard analyses and isolations alongside the job, so crews start on time.

  • No paid hours lost waiting at the control room or the storeroom.
  • Blockers show up days ahead, not at the asset.
See it in a Margin Walkthrough
safety health
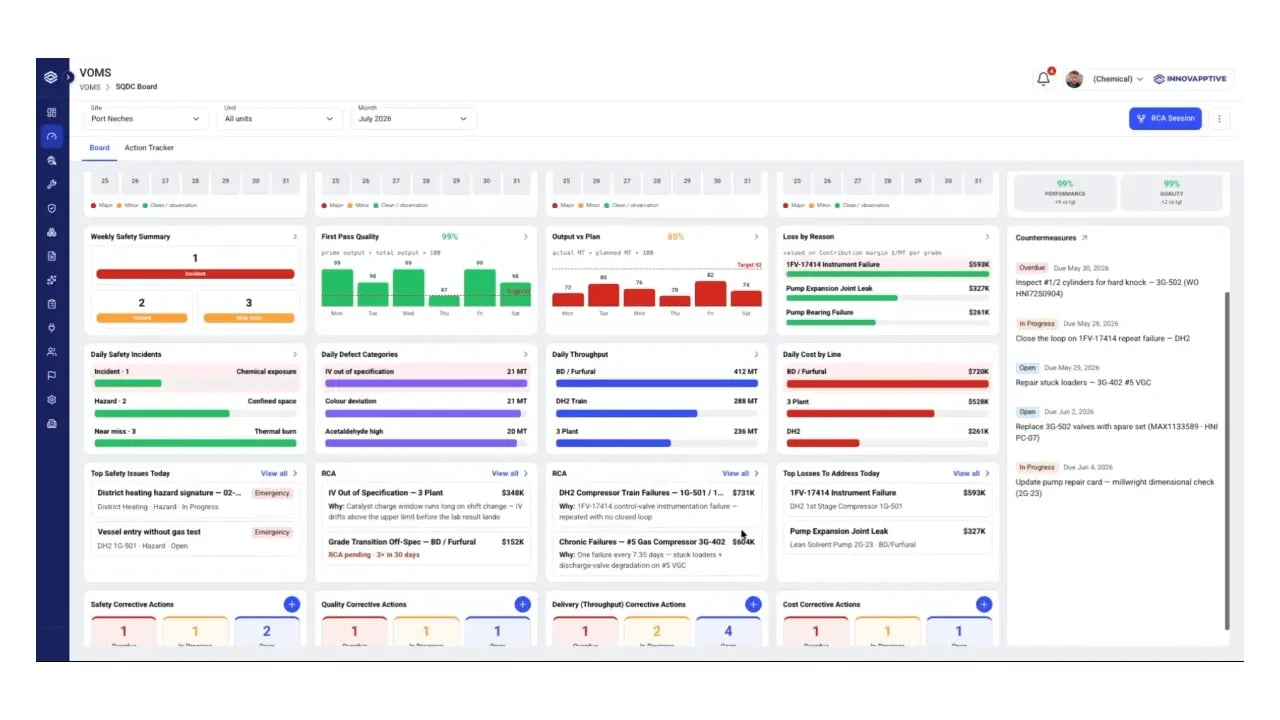
Daily Management & SQDC

Manage cost every day, not at month end

SQDC dashboards put overtime, contractor hours, backlog and spend in front of maintenance leaders daily, with actions tracked to closure.

  • Spot overruns while there is still time to act.
  • Daily management board with cost, delivery, quality and safety tiles and open actions
See it in a Margin Walkthrough
SQDC-Board
Customer proof

What happened when execution was connected at Indorama

Innovapptive connected frontline execution to the systems already in place, digitised paper work orders, and closed the reactive gap, without adding headcount.

Digital transformation works when it’s driven from the frontline—giving operators the power to improve execution and protect margin.
Mark Holden Mark Holden Chief Manufacturing and Technology Officer Indorama Ventures
$19M
realised EBITDA savings in 2025
58%
maintenance backlog cut, 24 weeks to 10
80%
PM to CM ratio, up from below 50%
140 → 83
contractors, without losing capacity

See how the site got there, step by step.

Read the Indorama story
Analyst Recognition

Recognized as a Leader in Connected Worker Platforms

Frost & Sullivan named Innovapptive 2026 Company of the Year and a Leader in its Frost Radar™ for Augmented Connected Worker, End-to-End Platforms, based on platform breadth, AI execution capability, and measurable customer impact.

Frost & Sullivan 2026 Company of the Year award badge — Innovapptive Connected Worker Platform
Frost & Sullivan Best Practices

2026 Company of the Year,
Global Connected Worker Platforms

Frost & Sullivan recognized Innovapptive for closing the frontline execution gap with its end-to-end connected worker platform.

Get the Report
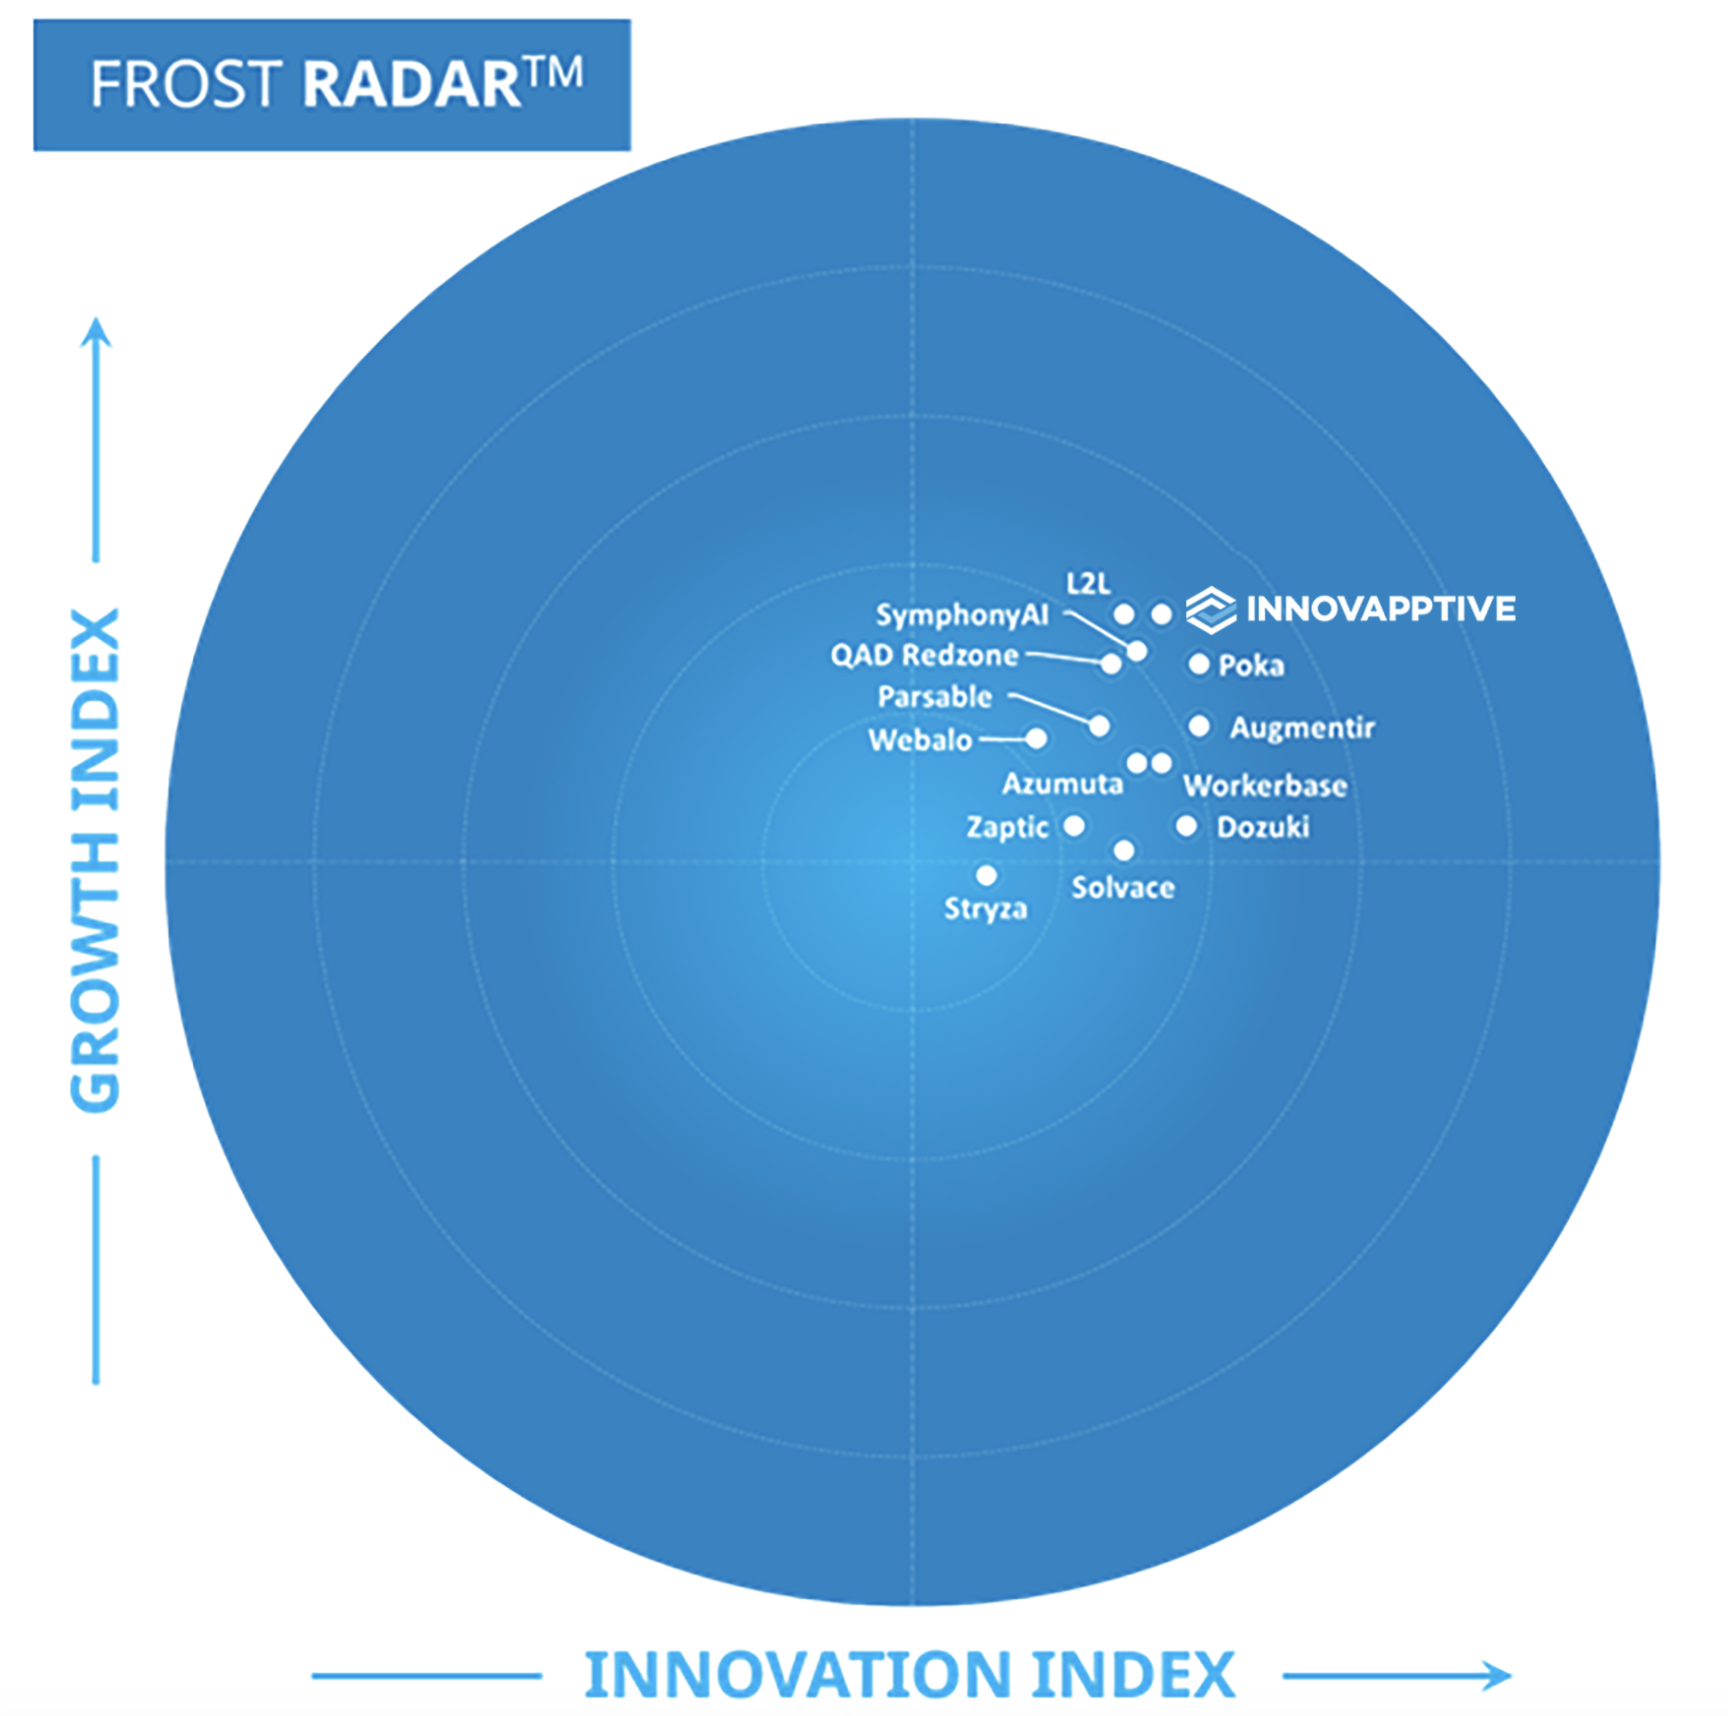
Frost Radar 2025 — Innovapptive positioned as a Leader in connected worker platforms
Frost Radar™ 2025

A Leader in Augmented
Connected Worker Platforms

Positioned as a Leader for connected worker platforms based on innovation, growth performance & proven enterprise scalability.

Get the Report
“Innovapptive has taken an innovative approach to AI, developing one of the most extensive AI agent portfolios available. These agents assist manufacturers with their maintenance, operations, reliability, safety, and analytics needs.”
Juan Francisco Dell'Era · Senior Research Analyst, Industrial Automation & Software, Frost & Sullivan
The next step

Find the cost your reports
cannot fully explain.

The Margin Walkthrough combines your data with two days on the floor. It shows where work waits, what that costs and what you can recover.

1

Understand the records

We review your maintenance, labor, parts and operations data.

2

Observe the floor

Two days on site, watching how work really moves and where it waits.

3

Quantify the gap

We put a cost on each cause, and show what we assumed and left out.

4

Prioritize the opportunity

You get a report with savings ranked and the first actions to take.

Your records show the spend.
The floor shows what to change.

Start with a Margin Walkthrough focused on the operating causes behind plant cost.

Also Explore

Improve Wrench Time

Know More

Optimize Inventory & MRO

Know More

Improve TPM

Know More
Common questions

Questions we hear from plant leaders

We start with an SAP or ERP data extract and the operating records for the areas in scope. Where data is thin, two days on the floor fill the gap. We agree the data and access with you before we start.

Open backlog is work not yet done, so it is not counted as savings. Every saving uses an agreed baseline, states its assumptions and exclusions, and says how the result will be checked.

No. Your current system stays in place. Innovapptive works on top of it and connects it to the people doing the work.

A Margin Improvement Report. It shows the evidence we reviewed, the gaps we found, the savings we can stand behind and the actions to take first. You keep it whether or not you continue.

Yes. The Margin Walkthrough is free. Scope, data and access are agreed with your team before any work begins.