
What Execution Latency Means in Manufacturing
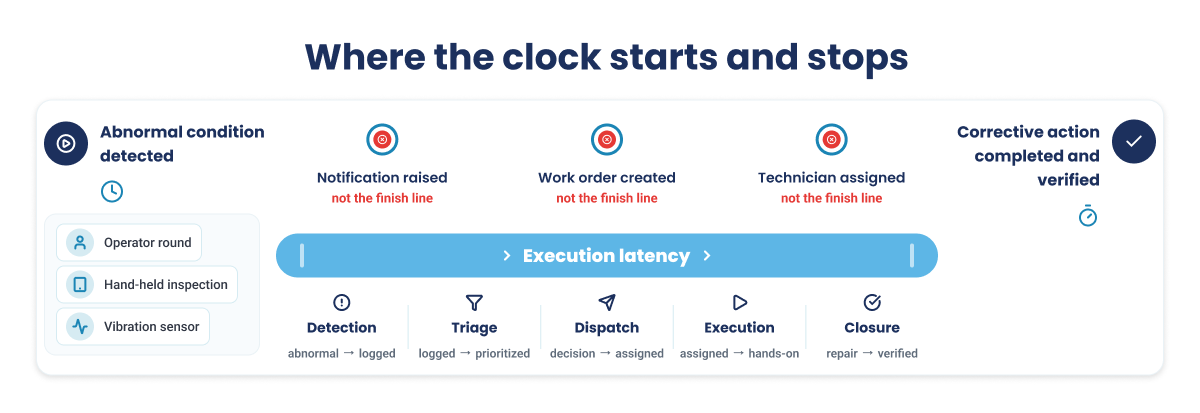
Execution latency is the total elapsed time from the moment an abnormal condition is detected to the moment the corrective action is completed, verified, and recorded.
While checking for execution latency in manufacturing the process begins the moment an abnormal condition appears, whether an operator notices it on a round, an inspection catches it, or a condition-monitoring sensor, or a predictive model flags it. It ends only when the corrective work is finished, verified, and logged. It does not end when someone is notified, when a work order is raised, or when a technician is assigned. Those are milestones along the way, not the finish line, and most plants stop counting at one of them. That is why the numbers on the board often look better than the plant's actual ground reality.
Analyzing latency only up to work order creation is the most common measurement error, and it hides the largest part of the delay: everything that happens after the paperwork exists but before the asset is actually fixed.
Measured properly, execution latency covers the full journey of a single finding:
- How long it takes before the issue is logged, triaged, and prioritized against other issues
- Time taken for the issue to become an assigned work order with a named owner
- How long before a technician is actually working on the asset, with the right parts and permits in hand
- Actual time taken to complete the repair
- Time taken to verify the outcome and feed it back to the model, the plan, and the parts assumption that generated the work.
Execution latency is not network or control-loop latency
The word latency carries three other meanings in an industrial setting, and none of them shares the same meaning with execution latency in manufacturing. When most engineers hear latency, they often think of control loops or actuator latency measured in milliseconds. Network and edge-computing latency is the delay in moving data between devices. Execution latency is a different thing entirely. It is not a hardware or data-transfer delay. Measured in hours, shifts, and days, execution latency is a delay in human handoff rather than a data transfer lag. A useful test: if faster equipment would fix it, it is not execution latency. If removing a handoff between people or systems would fix it, it is.
Why the Insight-to-Action Gap Keeps Plants Reacting Late
The insight-to-action gap is the disconnect between the volume of operational data a plant now collects and the frontline action that data actually produces. Put simply, plants have never known more about their assets and never struggled more to act on it in time.
To understand simply the insight-to-action gap is the condition and execution latency is the means to measure this gap. Most leaders often attribute this gap to technological issues or cultural lag. However, both of these are incorrect. The models work, the dashboards populate, and the alerts fire, and almost nothing changes on the plant floor. Further, it is tempting to blame worker resistance, poor training, or lack of buy-in for the latency. But the evidence points elsewhere. Latency is not a technology or cultural problem. It is an execution architecture problem. Organizations need to note that if you have already invested in analytics or predictive maintenance, that spend was not wasted. It was unfinished. The intelligence layer got built and the layer that carries a finding to a completed job did not.
| Manufacturing no longer has a visibility problem. It has an execution problem. Visibility does not create value. Execution does. |
Where systems of record, monitoring and insight stop short
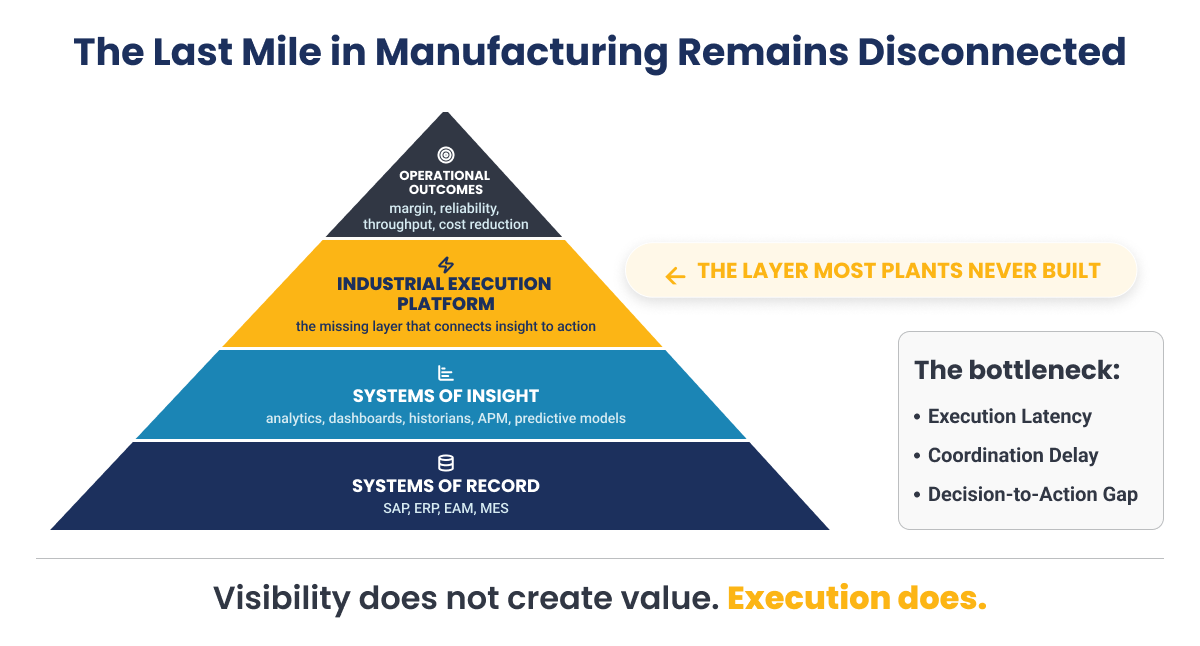
For more than fifty years, industrial companies have invested billions in three layers of technology, and both work well. The first is the system of record, the SAP, ERP, and EAM platforms that log every asset, work order, and cost. The other layers are the system of monitoring and insight, the historians, analytics, dashboards, and predictive models that tell you what is happening and what might fail. What almost no plant has built is the pivotal fourth layer, the one that turns a finding into a completed, verified job. That is where value is actually created, and it is the layer that is still missing.
| Layer | What it does | What it does not do |
|---|---|---|
| Systems of record | ERP and EAM log asset histories, work orders, parts, and financials. | Record activity after the fact, not guide how work should be done. |
| Systems of monitoring | SCADA, DCS, historians, and condition monitoring show real-time asset and process condition. | Detect an anomaly, but do not direct the response. |
| Systems of insight | Predictive and machine-learning models forecast failure risk earlier. | Generate recommendations that still need a human to act. |
| Execution layer | Connects a finding to a routed, packaged, executed, and verified job. | This is the layer most plants have never built. |
Each of the first three was a genuine advance in manufacturing operations, but what organizations need to remember is that visibility should not be the end goal. A dashboard can tell you what matters, however, it cannot make the plant act.
Despite having the systems of record, monitoring and insight in place the gap still persists mainly because:
- The insight and the work live in different places: A prediction sits in one system while the work order is created in another, so someone has to read one screen and retype it into the next.
- The finding arrives without the context a technician needs to act: A probability score or a one-line note does not tell a technician what failed, how urgent it is, or which parts to bring.
- No mechanism captures whether a recommendation was acted on: Without a closed loop, no one knows if the recommendation was acted on or whether it worked, so the plant never improves.
Operators as data collectors rather than issue managers
The origin point of latency is the plant floor during operator rounds. Industry research from McKinsey found that most frontline workers spend less than half their shift with hands on tools, and at many plants that figure is below 30 percent. Where documentation and administrative load dominate a shift, abnormal conditions get reported thinly, and a thin report costs far more downstream than it saves upstream.
Picture a single finding: an operator notes a bearing running hot but logs only a line of text at end of shift. Maintenance arrives without failure mode, history, or parts context, so the first visit becomes an assessment visit, not a repair. The technician diagnoses, leaves for parts, and returns the next day. One low-quality report has just turned a same-day fix into multi-day latency. If organizations fix the quality of that first report they essentially remove excess work everywhere after it.
Your AI Works. Your Plant Floor Doesn't Act. Here's The Fix.
See how leading plants close the insight-to-action gap with AI agents that carry a finding all the way from detection to a verified fix.
Where the Time Goes Between Detection and Repair
Total execution latency is almost never evenly distributed. In most plants, one or two stages hold the bulk of the delay, so treating it as a single problem hides where the time actually goes. Breaking it into five stages lets you find your own bottleneck. Each stage ties to a timestamp you can actually pull from a real system.
| Stage | What it measures | Timestamp source | Common failure |
|---|---|---|---|
| Detection | Abnormal condition to logged finding | Round or inspection record | Logged at end of shift, not on observation |
| Triage | Logged finding to prioritized decision | Notification creation to first status change | Alert volume without prioritization |
| Dispatch | Decision to assigned work order | Work order header and status history | Manual re-entry, approval queues, no owner |
| Execution | Assignment to hands on tools to repair | Mobile execution record | Parts not staged, permit not issued |
| Closure | Repair to verified and fed back | Closure confirmation | Closed with no outcome captured |
1. Detection: from abnormal condition to logged finding
Detection is the time from when a problem first appears to when it is written down as a finding someone else can act on. Problems surface four ways: an operator round, a scheduled inspection, a condition sensor, or a predictive model. The usual failure is simple. The issue is seen but not logged until the end of the shift, which adds hours before anything downstream can start. Detection is usually the stage plants have already invested in, so it is usually not the binding constraint. That is the point: more detection investment does not reduce latency.
2. Triage: from logged finding to prioritized decision
Triage is the wait between a finding being logged and someone deciding it matters and setting its priority. It is the hardest stage to see, because a finding waiting for attention usually leaves no timestamp of its own. The common failure is alert overload. Most plants generate far more alerts than anyone can work through, and with no way to rank them by real consequence, the one that matters waits behind the ones that do not. To measure it, use the gap between when a notification is created and when its status first changes. In many plants this is the single largest chunk of the total, and the one nobody is watching.
3. Dispatch: from decision to assigned work order
Dispatch covers turning a decision into a work order that is created, approved, and assigned to a named person. This is where the delay of disconnected systems shows up as lost time: someone retypes the finding from the monitoring tool into the work management system, approvals sit in a queue, and no one clearly owns the job. It applies to every kind of finding, not just sensor alerts, and in most plants operator and inspection findings make up the majority.
4. Execution: from assignment to hands on tools
Being assigned is not the same as work starting. This stage measures the gap between the two, plus the repair itself. It stalls when parts are not staged, permits are not issued, or the crew arrives without the context to fix it in one visit. This is where wrench time lives, but wrench time is only one slice of the total. Raising wrench time without fixing dispatch does not impact latency to a great extent.
5. Closure: from repair to verified and fed back
Closure is the step most plants skip, and it does not end when the wrench comes off. It ends when the outcome is confirmed and fed back to the model, the plan, and the parts list. The common failure is a work order marked complete with no record of what was found or done. The gap compounds without this stage, as a plant with no closure data cannot improve any of the four preceding stages, because it has no evidence about what worked. This is the stage that decides whether the metric improves over time or stays flat.
The Maintenance Leader's Blueprint For Closing The Execution Gap
Our blueprint lays out how to build an AI-driven maintenance strategy that compresses every stage, from detection through closure.
How to Measure Execution Latency in Your Plant
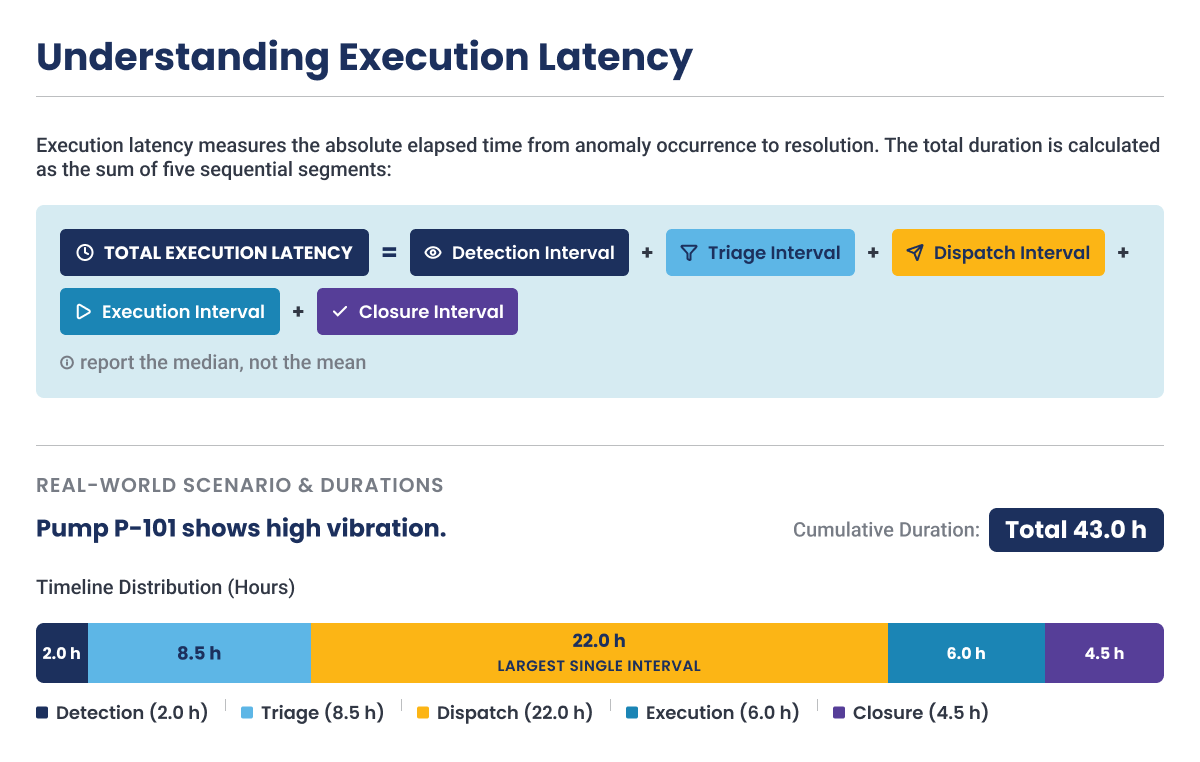
Put simply, execution latency is the sum of the time spent in each of the five stages. Add up detection, triage, dispatch, execution, and closure for a given finding, and you have the total for that job.
| Total Execution Latency = Detection Interval + Triage Interval + Dispatch Interval + Execution Interval + Closure Interval. |
Each term is the elapsed time in that stage, measured from the stage timestamps. When you report it across many jobs, use the median rather than the average. A single work order that stalls for weeks will drag an average badly and tempt everyone to dismiss the number as noise. The median tells you what a typical finding really experiences.
Map each interval to a system you already operate:
| Interval | Where the timestamp lives |
|---|---|
| Detection | Operator round or inspection record: observation time versus log time. |
| Triage | Notification record: creation time versus first status change. |
| Dispatch | Work order header and status history: creation, approval, and assignment stamps. |
| Execution | Mobile execution record: assignment time versus job start and completion. |
| Closure | Closure confirmation: completion versus verification and feedback recorded. |
Worked example: a vibration alarm on a critical pump.
Pump P-101 shows high vibration. In a disconnected plant, the finding moves like this. The hours below are illustrative, chosen to show how a routine finding becomes a multi-day event and where the time actually sits.
| Stage | Elapsed time | What happened |
|---|---|---|
| Detection | 2.0 h | Alarm noted, logged at shift end |
| Triage | 8.5 h | Alert sits in a dashboard overnight, no owner |
| Dispatch | 22.0 h | Largest interval: manual re-entry, approval, unassigned |
| Execution | 6.0 h | First visit diagnostic, second trip for the part |
| Closure | 4.5 h | Completed, outcome data not captured |
| Total | 43.0 h | Just under two days on one finding |
Notice that dispatch alone carries roughly half the total, and the repair itself is a small share. Start your measurement on one asset class at one site, not plant-wide. A narrow scope produces a clean baseline fast.
Where to pull each timestamp from
Use the round or inspection record for detection, the notification for triage, the work order header and status history for dispatch, the mobile execution record for execution, and the closure confirmation for closure. When a timestamp genuinely does not exist, use a proxy, and be honest that a proxy sets a floor rather than a true value: the real interval is at least this long and probably longer. Establish the baseline before you change anything, because a plant with no baseline cannot prove it improved.
Watch A Finding Go From Alarm To Fixed, Not From Alarm To Backlog
Take a short, self-guided tour and watch a finding move from the field to a verified fix without a single manual handoff.
Execution Latency Compared With Decision Latency, MTTR and MTTD
The established maintenance metrics measure detection and repair. None of them measures the waiting between those events, which is where the majority of the elapsed time usually sits. That blind spot is why a plant can report healthy numbers and still face significant execution delays. The table below shows what each metric captures and, more importantly, what it leaves out.
| Metric | What it measures | Clock start and stop | What it misses |
|---|---|---|---|
| Execution latency | Detection to verified corrective action | Starts at detection, stops at verified closure | Nothing: it spans the full journey |
| Decision latency | Signal available to decision made | Starts at signal, stops at the decision | Everything after the decision |
| Mean time to detect (MTTD) | Time to identify a fault exists | Starts at fault, stops at detection | All response and repair |
| Mean time to acknowledge (MTTA) | Alert firing to human ownership | Starts at alert, stops at acknowledgement | Dispatch, execution, closure |
| Mean time to respond (MTTR) | Time to restore once repair begins | Starts at repair, stops at restoration | All pre-repair waiting |
The metric that most often gives false comfort is MTTR. A strong MTTR says the repair is quick once it begins. It says nothing about the day and a half of the finding spent waiting to get there. Decision latency is closer, but it stops at the decision, while execution latency runs all the way to a verified fix. Think of execution latency as the metric that ties the others together, not a replacement for them. If you want the formal definitions of the established metrics, the maintenance and reliability metric standards from SMRP are a good reference.
What Slow Execution Costs an Asset-Intensive Plant
Every hour a finding waits keeps degrading the asset and pushes the eventual repair up the cost curve. For example, an asset, the pump P-101 we took as an example above, the anomaly of high vibration caught early was a routine seal job. However, as the finding waited through triage and dispatch, degradation continued: an $8,000 early-stage repair drifted toward a $35,000 planned intervention, and by the time the pump tripped and an emergency crew was called, the event had escalated past $175,000. Zero-latency response would have resolved the same anomaly in under two hours. That escalation is the cost of delay, and it is invisible on any dashboard that stops counting at work order creation.
The four places latency actually leaks money
Closing the insight-to-action gap is, in plain terms, one of the strongest levers a plant has to reduce maintenance cost, and it works across four cost lines at once.
| Cost leak | How latency creates it | How closing the gap recovers it |
|---|---|---|
| Labor and overtime | Waiting compresses work into premium overtime windows. | Faster routing spreads work into planned hours and cuts overtime. |
| Outside contractor spend | Slow internal response gets backfilled by contracted labor that becomes structural. | Higher first-time fix and faster dispatch bring work back in-house. |
| MRO inventory capital | Unreliable parts availability drives defensive over-stocking. | Parts aligned to real work reduce buffer stock and tied-up capital. |
| Lost production revenue | Small issues escalate into unplanned outages while they wait. | Earlier action prevents escalation to unplanned outages. |
The insight here is one of attribution. In most plants the first three leaks are larger together than lost production, yet none of them is ever booked as a latency cost. They show up as labor, contractor, and inventory lines. Reattributing them to slow execution is what turns it into a defensible business case. Industry research from McKinsey supports this: comprehensive, digitally enabled reliability can reduce maintenance cost by 18 to 25 percent and lift asset availability by 5 to 15 percent.
How Indorama Ventures closed the gap and cut maintenance cost
Indorama Ventures, a $15.4 billion global chemical producer, saw exactly this problem at its Port Neches, Texas facility, one of North America's largest ethylene oxide plants. It already ran both SAP PM and IBM Maximo, yet frontline work was still paper-based and reactive. The maintenance backlog had stretched to 24 weeks, and fewer than half of all work orders were planned.
By connecting frontline execution back to those existing systems, through mobile work orders, digital operator rounds, and real-time inventory, the site closed the gap between insight and action. Within 12 months the backlog fell 58 percent to 10 weeks, the preventive-to-corrective ratio climbed from 45 to 80 percent, contractor headcount dropped from 140 to 83, and inventory accuracy reached 99.5 percent. Together those gains delivered $19 million in realized EBITDA savings in 2025, with a further $50 million opportunity identified as the model scales across the enterprise, and none of it required replacing a core system.
How Indorama Cut Its Backlog By 58% & Unlocked $50M In Savings
The full case study breaks down how a $15.4 billion chemical producer cut its backlog from 24 to 10 weeks and realized $50 million in EBITDA savings, all inside its existing SAP and Maximo environment.
Why Dashboards and Predictive Models Do Not Close the Gap
Dashboards, historians, and predictive models are genuine advances, and plants that bought them were right to. The mistake is expecting them to close the gap on their own. They tell you what is wrong. They do not get it fixed.
| Industrial AI without frontline execution is simply an expensive prediction. |
More visibility does not help once the delay lives after the alert, in triage, dispatch, and execution. A sharper view of a problem you already knew about does not shorten the wait for the technician. Better analytics earn their keep only when they trigger work rather than just display it. So the answer is not another screen. It is a short, practical process that moves the delay, drawn from what actually works in the field.
- Audit the path from insight to action before buying more intelligence: Map the steps between a recommendation and a completed job. Count the handoffs and the retyping. A simple model fully wired into the workflow beats a brilliant one whose output no one acts on.
- Turn operators into problem solvers, not data-entry clerks: Automate the routine capture so the finding arrives complete, with failure mode, photo, and context, the first time.
- Build the knowledge layer that makes a recommendation trustworthy: Connect asset history, procedures, failure modes, and parts so a finding arrives as an instruction a crew can act on, not a research task.
- Decide what the system may do on its own before you need it: Set the boundaries for automatic action, human confirmation, and human initiation up front, and build them into the configuration.
- Measure outcomes, not outputs, and tie them to margin: Alert volume, model accuracy, and dashboard logins are proxies. Track resolution speed, maintenance cost per unit, and downtime, and connect them to EBITDA.
How to Cut Execution Latency at Every Stage
Start by measuring, then go after the largest stage first, which is usually triage or dispatch rather than the repair. The levers below are ordered by the impact they typically deliver.
1. Capture findings at the point of observation
This targets detection. When operator rounds and inspections are digital, a finding is logged the moment it is seen, complete with failure mode, asset, and a photo, instead of at the end of the shift.
Result: Detection drops from hours to minutes, and because the report arrives with context, the diagnosis work downstream shrinks too.
2. Route findings automatically into work management
This targets dispatch, usually the biggest stage. Rules-based conversion turns a qualified finding or sensor alert into a work order in the enterprise system with no manual re-entry, in SAP, IBM Maximo, or Oracle as supported destinations. However, automatic routing is not automatic approval, for safety-critical and isolation-related actions it retains human authorization.
Result: The dispatch interval collapses from days to hours, and the unassigned-ownership failure disappears.
3. Package the job before the technician starts work
This targets execution. When planning and scheduling assembles a work package with procedure, permit, parts, and history attached, the first visit is a repair visit rather than an assessment visit. However, the success of this step depends on a connected knowledge layer linking asset hierarchy, maintenance history, failure modes, operating condition, procedures, and parts. A recommendation without failure mode, consequence, timing, and parts availability is a research task handed to a technician, not an instruction.
Result: First-time fix rate rises, second-trip frequency falls, and the execution interval shortens without anyone working faster.
4. Close the loop with verified outcomes
Targets closure, and every preceding stage over time. When completion is captured with real outcome data and fed back to the model, the plan, and the parts list, the number keeps improving. Skip this and you can reduce latency once, but you cannot keep reducing it.
Result: The metric improves month over month rather than resetting, because each cycle produces evidence about which interval moved and why.
5. Decide what the system may do without a human in loop
In a refinery or chemical plant, a wrong automatic action is not a minor inconvenience, so decide the boundaries up front. Define what the system may do on its own, what needs a human to confirm, and what a human must always initiate, and build those rules into the configuration, not just a policy binder. Three mechanisms keep the boundary auditable: confidence thresholds that escalate rather than act, audit trails that make any automated action legible after the fact, and fail-safe defaults that route to a human when conditions fall outside what the system has seen.
Human-in-the-loop is not a concession that slows the plan down. It is the correct architecture for consequential environments, and it is what makes the latency reduction defensible to process safety, EHS, and audit.
For the first 90 days, keep the scope tight: one asset class at one site. Baseline the five stages, attack the biggest one, and instrument closure so the gains hold and compound.
Discover The 15 AI Agents That Shrink Your Maintenance Backlog
Learn how AI agents that capture findings, route them, package the job, and close the loop across all five stages.
How Innovapptive Helps Plant Teams Cut Execution Latency
Innovapptive is an industrial execution layer that sits above your existing ERP or EAM. It carries a finding from the point of observation through routing, packaging, mobile execution, and verified closure without a manual handoff between systems. It does not replace SAP, IBM Maximo, or Oracle, it puts them to work by connecting the insight they already produce to action on the floor. That is the whole design: to remove the handoffs where execution latency accumulates.
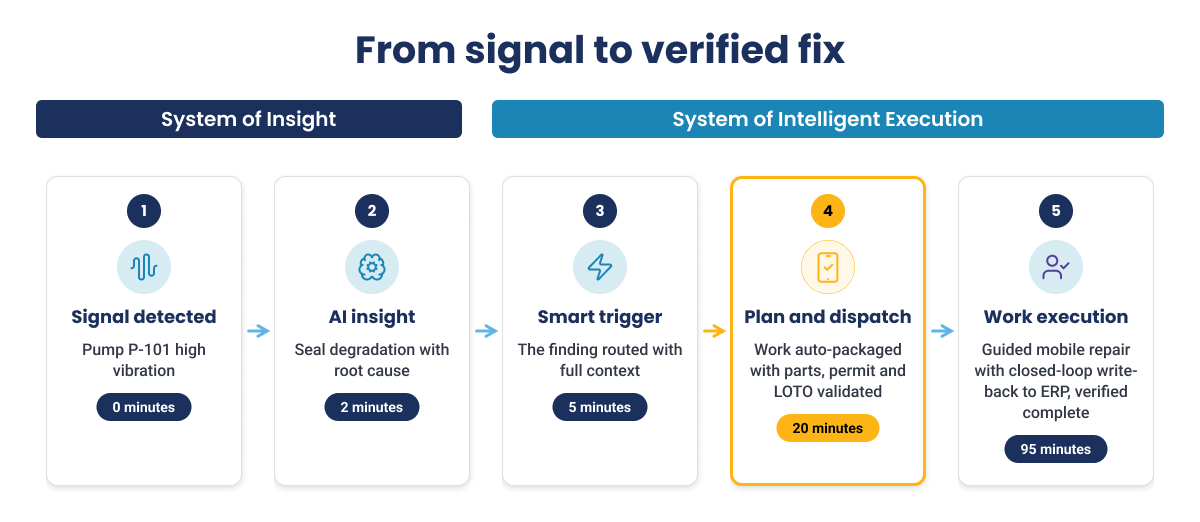
The clearest way to see it is to follow the same Pump P-101 mentioned in the worked example above through a connected plant. The first two steps come from the system of insight the plant already owns. The moment the finding needs action, the system of intelligent execution takes over, and Innovapptive Connected Worker Platform is that layer.
| Step | What happens | Time Elapsed | What powers it |
|---|---|---|---|
| 1. Signal detected | Pump P-101 flags high vibration | 0 min | System of insight (historian, APM) |
| 2. AI insight | Seal degradation identified, root cause misalignment | 2 min | System of insight (ML and analytics) |
| 3. Smart trigger | Finding routed with context, dynamic round and troubleshooting raised | 5 min | Operator Rounds, Digital Inspections, and WorkSmart AI |
| 4. Plan and dispatch | Work auto-packaged, parts assigned, permit and LOTO validated | 20 min | Planning & Scheduling Software, Warehouse Inventory Management Software, ePTW Software |
| 5. Work execution | Guided mobile repair, closed-loop write-back to ERP | 95 min | Mobile Maintenance Software and Digital Work Instructions |
The same finding that took nearly two days in a disconnected plant is verified complete in 95 minutes. The insight did not change. The execution did. That is the whole idea behind the system of intelligent execution: the first two steps stay in the tools you already own, and everything after the finding runs as one connected flow instead of a chain of manual handoffs.
That breadth, spanning both the moment a problem is found and the work that resolves it, is also why Frost & Sullivan named Innovapptive a leader in its 2025 Frost Radar for connected worker platforms, citing the depth of its execution and AI capabilities. . As Indorama Ventures found at Port Neches, described earlier, the gains came with no ERP replacement, because the platform activated its existing SAP and Maximo systems rather than displacing them.
Bring Your Own Five-Stage Baseline & Your Maintenance Cost Target.
We will show your team where the time is going and what a connected execution flow would change, with no ERP replacement on the table.

Unlock Margins Hidden in your Maintenance
Watch how leading manufacturers improve OEE, increase PM compliance, and reduce downtime through connected execution.

- 15-10-2026
Maintenance Digitalization: A Digital Transformation Guide
Maintenance digitalization is the shift from paper, spreadsheets and disconnected tools to...

- 12-10-2026
Manufacturing Skills Gap: What It Costs and How to Close It
A plant can have every role filled and still experience a manufacturing skills gap. Very often,...

- 05-10-2026
10 Best Shift Handover Software Platforms for Plant and Process Operations
Shift handover software can mean different things depending on the operating environment. Some...