What Is Wrench Time?
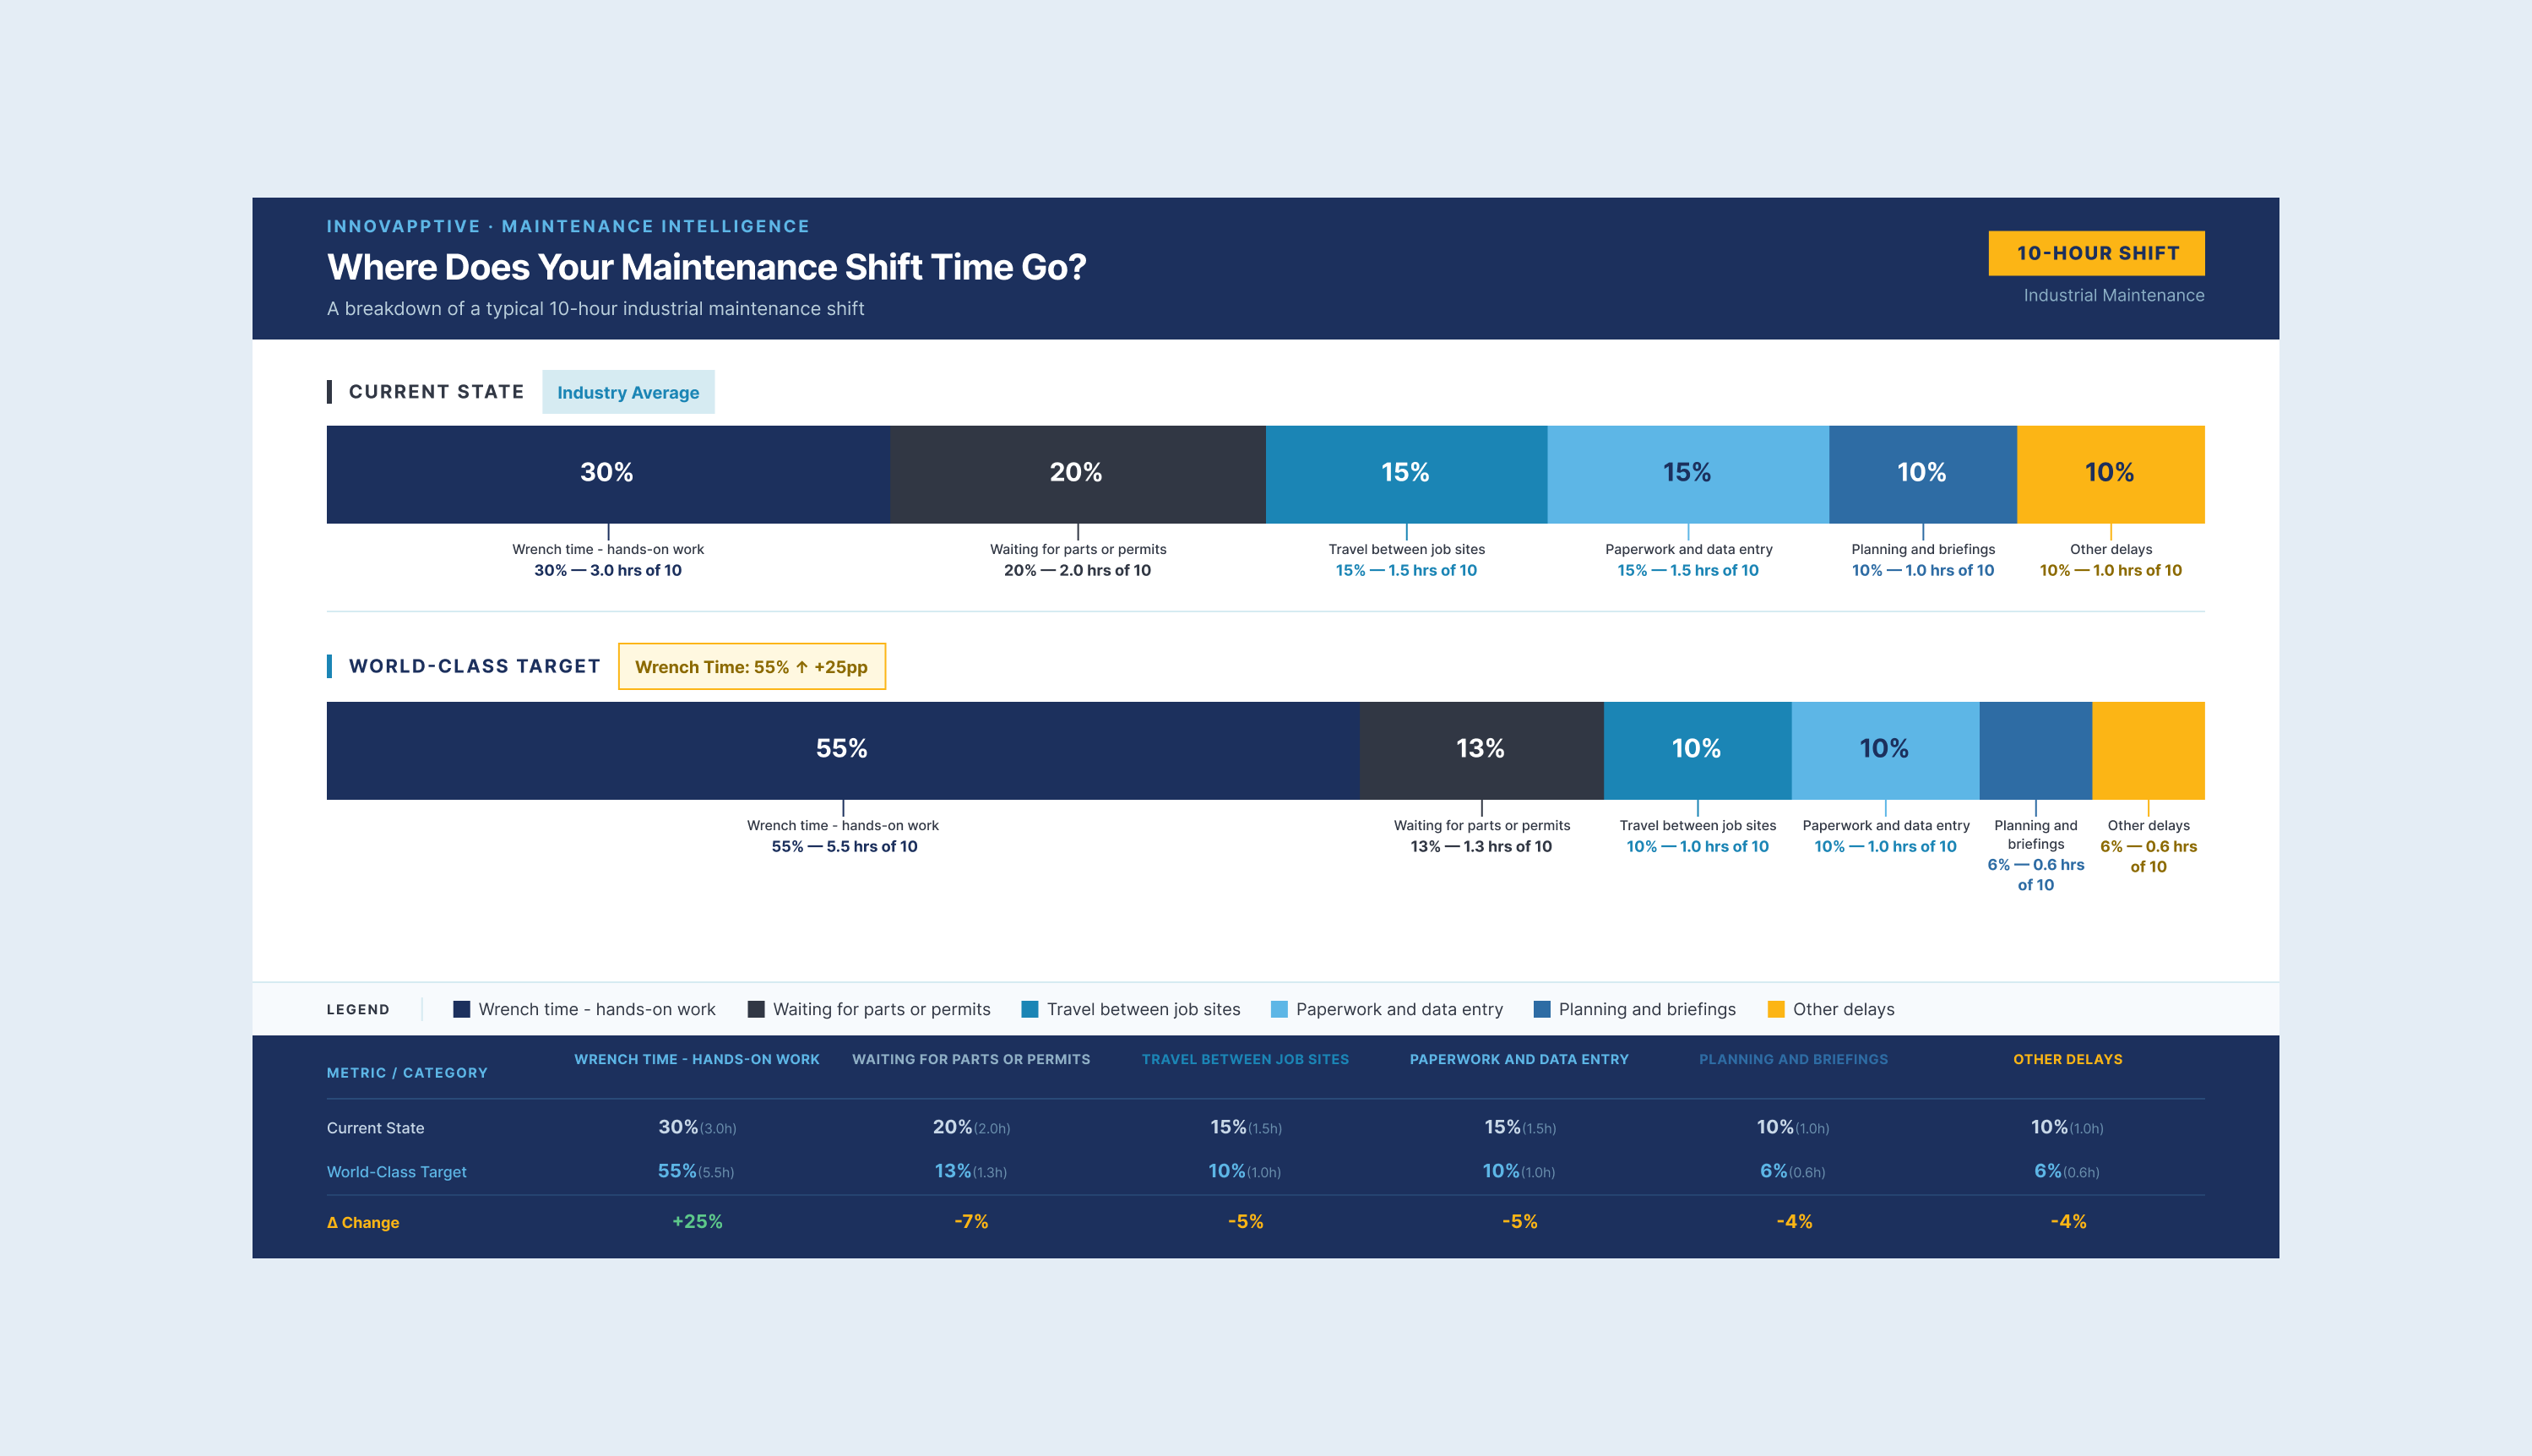
Wrench time, also called tool time, is the percentage of a maintenance technician's shift spent actively performing hands-on work on equipment. Take for example a technician on a 10-hour shift who logs 3 hours of direct maintenance work, their wrench time is 30%. The metric is tracked as a percentage of total available shift time, rolled up by job, or across a monthly or quarterly window depending on how a facility uses it.
What makes tool time useful is not the number itself, it is what the number forces you to examine. When it is low, the instinct is to question technician effort. The more productive question is: what is consuming the other 65 to 75%? Parts never staged, work instructions requiring an office trip, permits sitting unapproved at the job site, these are planning and system failures, not workforce failures. Wrench time is the signal; the non-wrench activities are where the diagnosis begins.
Industry data puts the typical average at 25 to 35%. On a 10-person crew, that is roughly three technicians worth of productive output, lost not because of how hard people work, but because of how poorly the work is set up.
The Wrench Time Formula
Wrench time is calculated by dividing the total time a technician spends on hands-on maintenance tasks by their total available work time, then multiplying by 100 to express it as a percentage.
Wrench time calculation examples:
- Scenario A: Typical facility: A technician works a 10-hour shift. Of that, 3 hours are spent on direct equipment work. The remainder goes to travel, parts retrieval, permit coordination, and documentation. Wrench time = (3 ÷ 10) × 100 = 30%
- Scenario B: After process improvement: The same technician, same shift length. Structured job planning, kitted parts, and digital work orders mean 5.5 hours go toward direct maintenance work. Wrench time = (5.5 ÷ 10) × 100 = 55%
One important note on the denominator (total work time): total available work time excludes contractually required breaks. Using raw clock hours deflates the result and makes the performance gap look larger than it is, which matters when setting realistic improvement targets.
20–30% Improvement in Wrench Time. Here's the Blueprint.
AI-driven maintenance isn't a future-state concept, it's a documented path from fragmented data and reactive scheduling to continuous execution.
Download AI in Maintenance BlueprintWhat Wrench Time Does NOT Measure
Wrench time captures time-on-task. It does not measure work quality, technician skill, repair effectiveness, or whether the right assets are being maintained. A technician who spends 55% of their shift with tools in hand is not inherently doing better maintenance than one at 35%, the difference may simply be that their facility plans and supports the work more effectively.
Activities that wrench time excludes are:
- Site travel and movement between jobs
- Sourcing and retrieving parts from the storeroom
- Waiting on permit-to-work clearance
- Manual data entry and SAP work order updates
- Pre-job briefings and task communication
- Lockout/tagout and equipment isolation
- Shift handovers and coordination time
Taken together, these exclusions form the map of where non-wrench time goes. When carefully examined they point to a specific planning, materials, safety, or technology gap that facilities can address and improve productivity.
Internal vs. External Wrench Time
Internal wrench time refers to the productive time of employed maintenance technicians. External wrench time refers to contracted or outsourced maintenance teams working alongside or in place of internal staff. Each group needs its own baseline while calculating wrench time, because the factors limiting their productive time are different.
Contractor teams carry overhead that internal teams do not: vendor onboarding, site inductions, certification checks, and regulatory PTW clearance that can hold an entire crew at standstill before the first job starts. Without separate tracking, that wait time gets averaged into internal performance data, the true cost of outsourced maintenance stays hidden, and managers end up optimizing the wrong workforce.
This gap matters most during shutdowns and turnarounds, where contractor volume spikes and permit coordination becomes the single biggest driver of schedule variance.
Wrench Time Benchmarks: What Is a Good Wrench Time?
The consensus wrench time benchmark range, established by Ricky Smith and R. Keith Mobley and supported by SMRP (Society for Maintenance and Reliability Professionals), puts typical wrench time at 18 to 30% and world-class performance at 55 to 65%. The gap between those two numbers represents the single largest recoverable productivity opportunity in most maintenance organizations.
Performance Tier Scale:
| Performance Tier | Wrench Time Range | What It Typically Indicates |
|---|---|---|
| Underperforming | Below 25% | Significant process, planning, and parts availability failures |
| Industry Average | 25–35% | No structured planning and scheduling program in place |
| Above Average | 36–45% | Some process improvements; inconsistent execution |
| Good | 46–54% | Structured planning, scheduling, and CMMS or mobile work orders |
| World-Class | 55–65% | Fully optimized planning, digital execution, and proactive maintenance |
Generic benchmarks only tell part of the story. A refinery and a general manufacturing plant are not the same operating environment. Complex lockout procedures, vessel entry requirements, and remote equipment locations all limit the theoretical ceiling for wrench time in ways that generic benchmarks do not account for. Industry-specific ranges give a more honest target.
Industry-Specific Directional Ranges:
| Industry | Typical Range | Primary Wrench Time Factors |
|---|---|---|
| Oil and Gas (upstream/downstream) | 22–30% | Complex LOTO, remote locations, regulatory permit requirements |
| Chemical Processing | 25–32% | Extended permit-to-work times, specialized certifications, vessel entry |
| Utilities and Power Generation | 28–36% | Scheduled outage windows, regulatory compliance, switching procedures |
| General Manufacturing | 34–45% | More accessible equipment, shorter travel distances, simpler tasks |
| Mining and Metals | 18–28% | Remote job sites, long travel times, heavy machinery access |
*These ranges are directional. Check SMRP maintenance and reliability benchmarks for validated data specific to facility type and asset base.
Maintenance teams need to understand that the goal is not 100% wrench time. It is identifying the realistic performance gap for specific operational context. A 40-person maintenance team operating at 35% tool time has the productive output of roughly 25 technicians. Moving that team to 55% recovers the equivalent of 8 full-time technicians, at zero additional labor cost.
The ROI of Improving Wrench Time
The business case for wrench time improvement is built on one simple calculation: more hands-on time from the same workforce, without adding headcount.
Wrench time ROI calculation:
| Scenario | Team Size | Wrench Time | Technician-Equivalent Output |
|---|---|---|---|
| Current state | 40 technicians | 35% | 14 technician-equivalents |
| World-class target | 40 technicians | 55% | 22 technician-equivalents |
| Net gain | - | +20 percentage points | +8 technician-equivalents |
Moving from 35% to 55% wrench time increases productive maintenance output by approximately 57%, with no additional hiring. For a process plant spending $80M–$120M annually on operations and maintenance, that productivity recovery translates directly to the bottom line.
See how 15+ AI Agents Unleash $30M + EBITDA Gains
Watch Product TourHow to Measure Wrench Time: 4 Traditional Methods and the Modern Alternative
Choosing a measurement method matters more than most organizations realize. Each traditional approach carries its own systematic bias. The method you choose determines how far off your baseline actually is, and all four traditional methods tend to overstate performance compared to what a continuous digital record would show.
| Method | How It Works | Typical Result | Key Limitation |
|---|---|---|---|
| Statistical Work Sampling | Trained observer logs technician activity status at randomized intervals across several weeks | Most accurate traditional method | Resource-intensive; observer required; limited to the observed work area |
| DILO (Day in the Life Of) | Single observer follows one technician through a full shift | Typically inflated - 50%+ | Observer Effect alters technician behavior; a single day captures neither demand variability nor typical interruptions |
| Self-Reporting | Technicians log their own active task time | Frequently 70%+ | Produces the least reliable data; workers report higher to protect against performance scrutiny |
| Periodic Work Sampling | Observer checks the work area at scheduled intervals | Typically inflated - 50%+ | Technicians not in the observed area are missed; delay locations outside the area go uncaptured |
| Automated Digital Tracking | Mobile platform records task start and stop times automatically via work order activity | Continuous and accurate | Requires mobile work order adoption; change management investment upfront |
While DILO studies are most commonly used they are least reliable. When a technician knows they are being observed, they stay productive, the observer effect inflates results to 50% or higher when reality is closer to 25 to 35%. One day also cannot capture the demand variability, emergency interruptions, and parts delays that define a normal maintenance week.
Statistical work sampling remains the most reliable traditional method. Distributing observations randomly across weeks and multiple observers dilutes the observer effect and captures a fuller range of shift conditions.
Self-reporting often inflates numbers not out of dishonesty but mainly because technicians feel that tool time will be used as a measure of their own productivity and not to diagnose system failure. This often makes them report defensively. This is the reason why how you introduce a wrench time study to your workforce shapes data accuracy.
Automated digital tracking sidesteps all of this. When technicians work through mobile work orders, task time is captured as a byproduct of normal execution, no observer, no study window, no overhead. Accurate tool time data becomes continuous rather than periodic, and the most reliable way to accurately capture wrench time at scale.
Stop Estimating Wrench Time. Start Measuring It
Mobile work order management eliminates the gaps between SAP, your planning team, & your technicians in the field enabling real-time execution & automatic data capture.
Download WhitepaperWhy Is Wrench Time Low? 7 Root Causes
Low tool time is almost never a technician performance problem. Organizations that cut headcount based on low wrench time numbers without first understanding the process failures driving those numbers see no lasting improvement, infact they often end up losing experienced technicians and watch performance fall further.
The seven root causes below are the most significant contributors to low tool-in-hand time.
- Poor maintenance planning and scheduling: When a technician arrives without the right parts, tools, or access clearance, they don't wait, they get pulled into reactive work. That displaces planned PMs, which increases failure probability, which generates more reactive work. Facilities with no dedicated planner role rarely sustain wrench time above 30%, regardless of technician skill.
- MRO spare parts unavailability: Parts unavailability is a planning failure as much as a storeroom failure, and it should be caught at work order creation, not at the storeroom door. In SAP environments, inventory data in SAP MM is frequently out of sync with actual shelf stock, meaning technicians discover shortages at execution time, not planning time. Mobile integration with SAP MM surfaces parts availability during work order planning, closing that gap before it reaches the field.
- Excessive travel time: Two travel types consume wrench time differently. Routing inefficiency due to poor job sequencing requires scheduling optimization. Information-driven travel which are trips back to the office for work instructions, permit forms, or SAP updates requires a mobile device. Tracking tool time through mobile work execution eliminates information-driven travel entirely by putting everything the technician needs on their device at the job site.
- Lockout/tagout and permit-to-work delays: LOTO is non-negotiable. The paper PTW process around it is not. In process plants, a technician can arrive job-ready and wait 30 to 90 minutes for a supervisor to sign a paper permit. An electronic permit-to-work integrated with the work order converts that wait to zero by routing approvals electronically before the technician leaves for the job site.
- Reactive maintenance culture: Reactive maintenance is a data problem, not a mindset problem. Without historic trends, vibration data, or thermal readings, facilities have no early warning system. AI-powered anomaly detection breaks the reactive cycle by triggering work orders on condition rather than on failure, giving planners scheduled work to execute instead of breakdowns to chase.
- Administrative burden and paperwork: Work order confirmation, material posting, and notification entry done manually at a desktop terminal can consume 30 to 60 minutes per technician per day, none of it wrench time. The challenge is not just lost time; data entered hours after job completion is less accurate, degrading the maintenance history that planning teams depend on. Mobile SAP integration converts that end-of-shift session into real-time field completion, recovering both the time and the data quality.
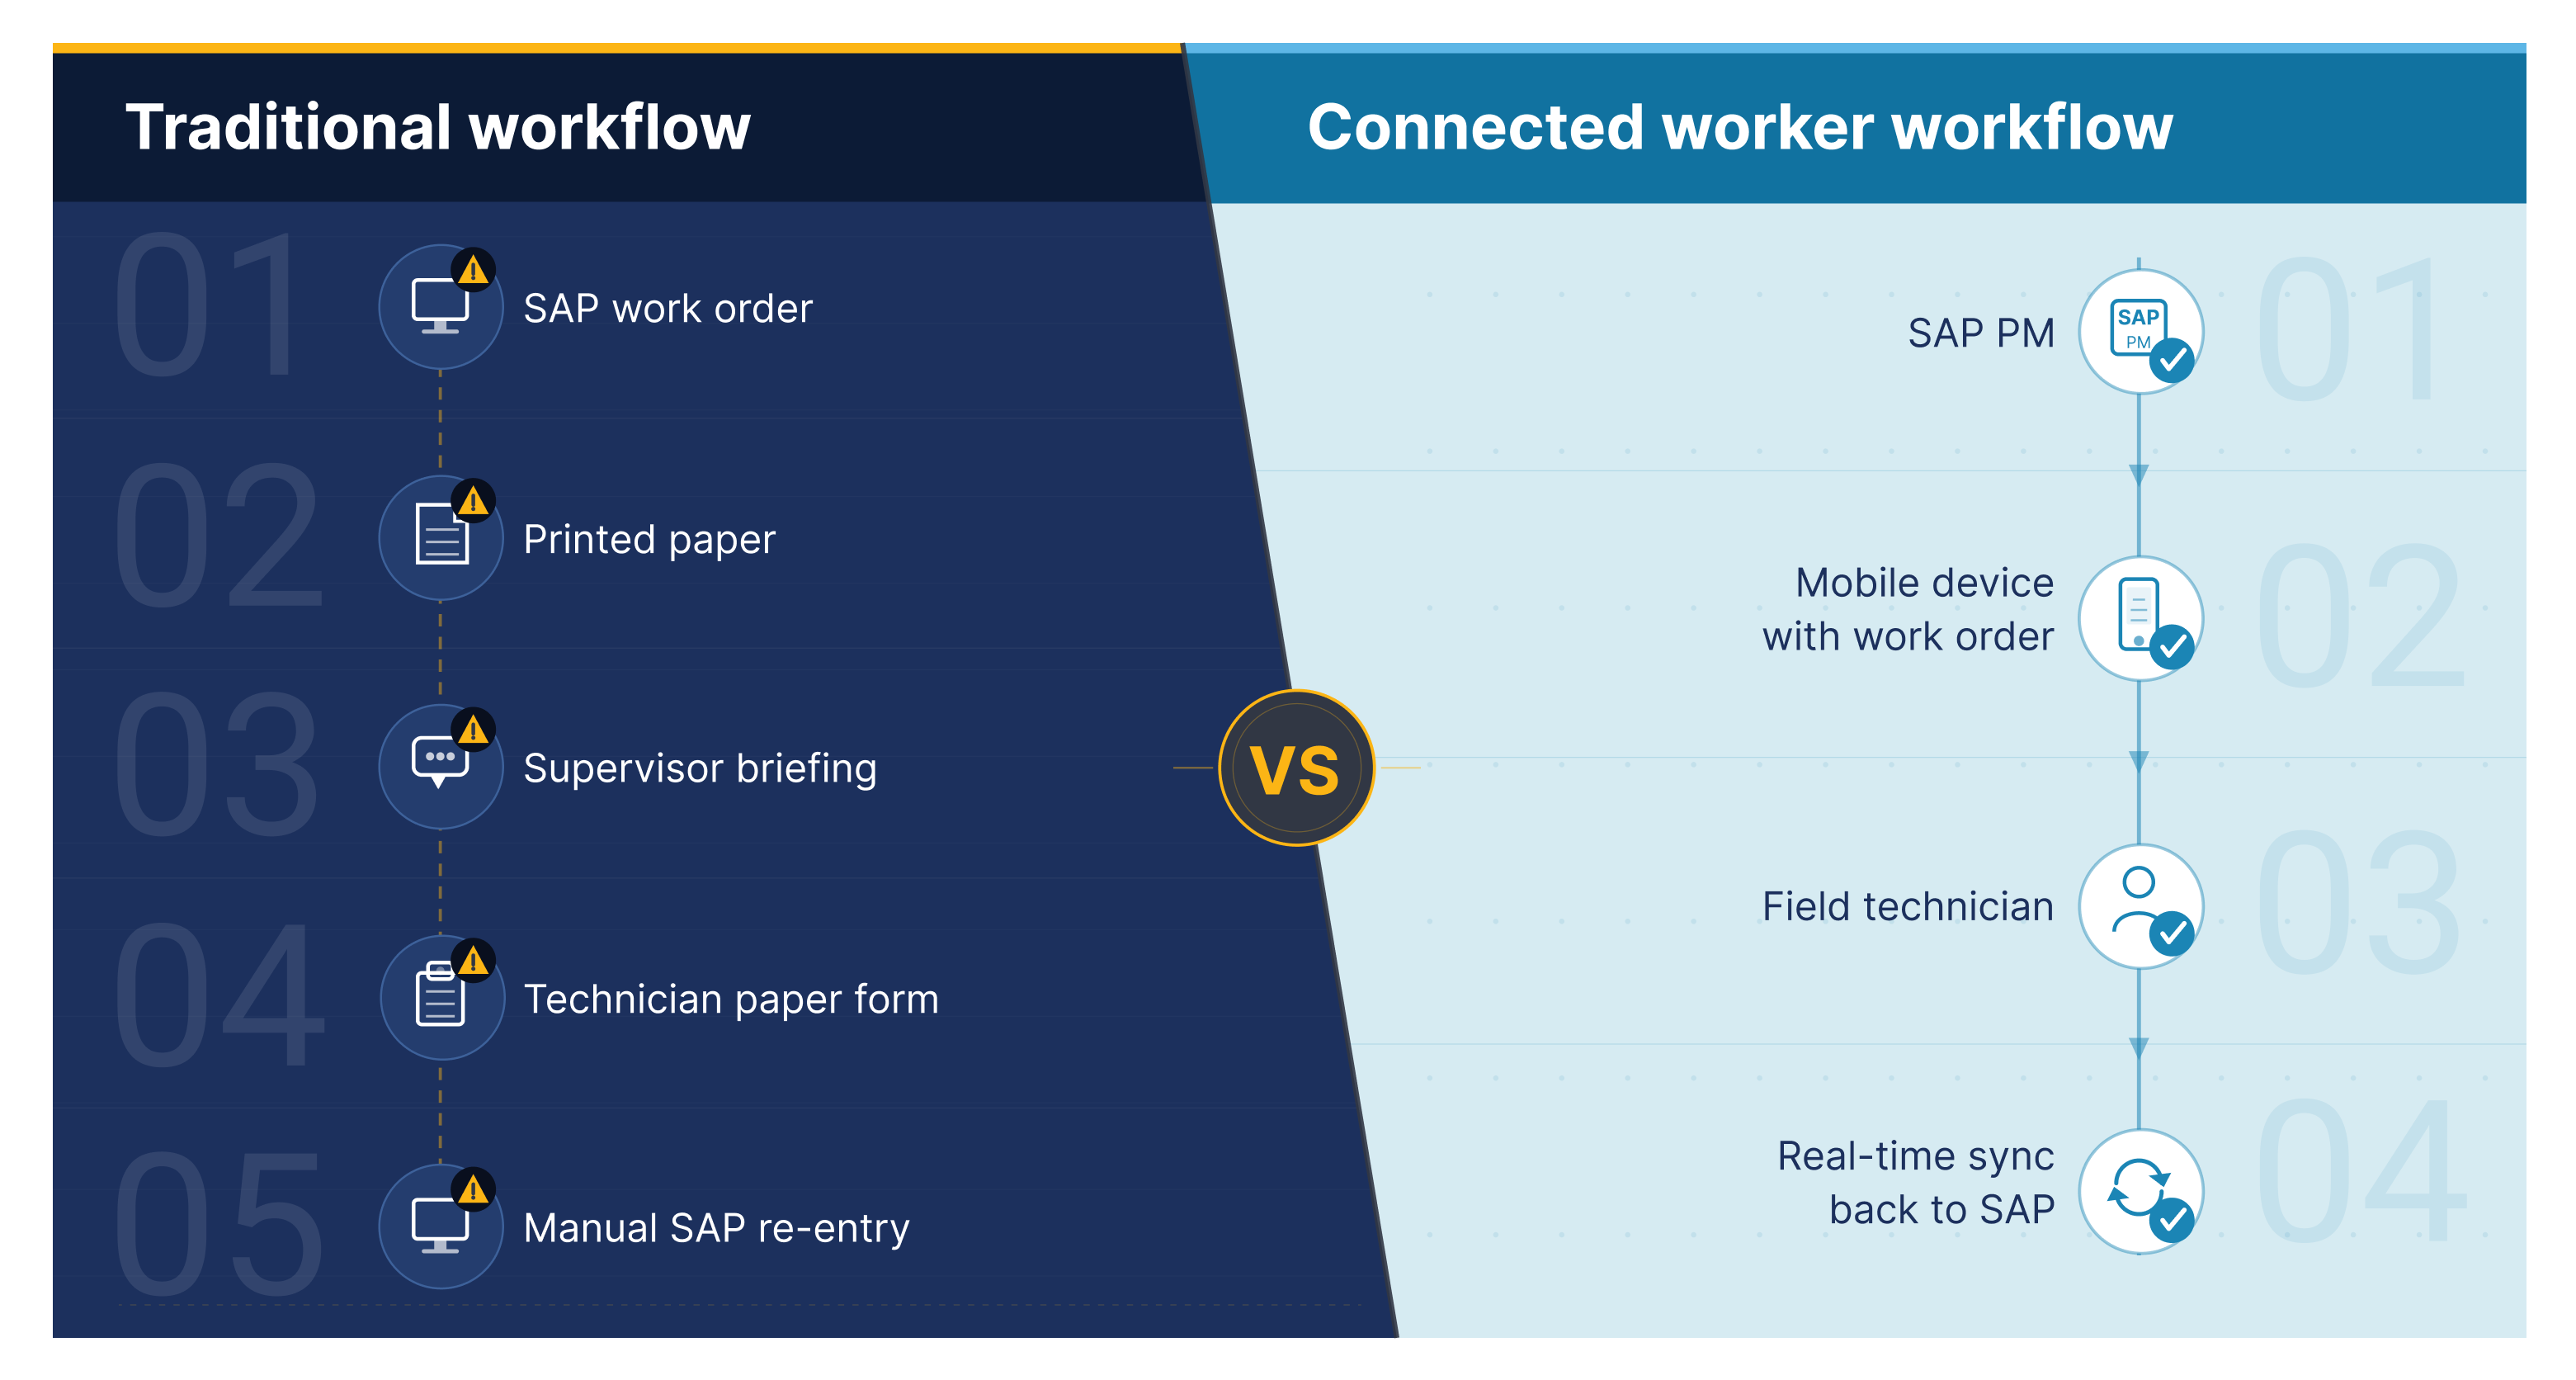
- Siloed ERP and field execution systems: In a traditional ERP environment, a work order passes through four to five manual handoffs before a technician starts work, and repeats the process in reverse for completion data. Each handoff is a delay, a transcription risk, and a wrench time leak. This is the gap no CMMS addresses, because the CMMS sits on one side of it. A connected worker platform with native ERP integration eliminates the relay: work orders push to mobile devices, completion data syncs back to ERP automatically, and the friction disappears.
How to Improve Wrench Time: 7 Proven Strategies
Moving from industry-average to world-class wrench time is a two-stage journey, process discipline closes the early gap, digital infrastructure sustains the gains. The seven strategies below follow that progression, starting with the planning and storeroom fundamentals that any facility can act on today, and building toward the technology layer that separates 45% performers from 55%+ ones. The seven strategies below showcase how organizations can maximize tool time.
1. Implement Formal Maintenance Planning and Scheduling
It is imperative for organizations to understand formal and informal maintenance planning. An informal planning process is where a supervisor allocates jobs verbally at the start of each shift based on what they know is pending which produces inconsistent job preparation and high rates of mid-job abandonment. A formal planning and scheduling includes a dedicated planner role, a managed work order backlog, and job packages that reach technicians complete: parts staged and confirmed available, permits initiated, work instructions attached, access clearances arranged.
When planning is done right, technicians execute without spending time on overheads. SMRP data and the ReliablePlant research by Ricky Smith supports this clearly: a properly structured planning and scheduling program can improve wrench time by the equivalent of one additional technician per crew of 10. For a 40-person team, that is four technician-equivalents recovered from process improvement alone, before any technology investment.
2. Shift from Reactive to Preventive and Predictive Maintenance
A facility cannot plan its way out of a reactive maintenance culture if it lacks the data to anticipate failures. The first step is building maintenance history, consistent work order completion data that reveals failure patterns and PM effectiveness. The second is moving toward condition-based triggers: historic data and IoT sensor readings that flag anomalies before failure and generate work orders automatically.
This is where the reactive-to-proactive shift becomes operational rather than aspirational. The planning team gains work they can prepare for in advance. Technicians arrive at jobs with job packages instead of improvised repairs. Innovaptive's historic-triggered autonomous scheduling operationalizes this shift without requiring a separate predictive maintenance software investment.
3. Optimize the MRO Storeroom and Introduce Parts Kitting
Kitting is simple in concept and consistently underpracticed: before a work order is released, a storeroom attendant confirms and stages everything the job requires, parts, consumables, specialty tools, in a labeled container. The technician collects the kit and goes directly to the asset. No storeroom search, no substitution decisions, no mid-job delay when a component turns out to be missing.
The prerequisite is accurate inventory data. Kitting against an SAP MM record that does not reflect actual shelf stock creates a false confidence problem. Real-time inventory integration ensures that what gets staged is what is actually available and that parts shortages surface during job planning, where they can be resolved, rather than at job start, where they cannot. Innovaptive's mobile inventory management with SAP MM integration surfaces live parts availability at work order creation, so kitting is completed against confirmed stock, not assumed stock.
4. Develop Digital Work Instructions and SOPs
The gap between a paper SOP binder in a supervisor's office and a digital work instruction on a technician's mobile device is not just a format difference, it is a reliability difference. Paper instructions go missing, get annotated, and reflect whatever version was printed months ago. A technician working from memory because the correct procedure was unavailable at the job site is a quality risk and a wrench time loss simultaneously.
Digital work instructions embedded in mobile work orders are version-controlled, always current, and include media: photographs of the specific asset configuration, video for complex sequences, marked-up diagrams for reference. They are completed as an in-app checklist that becomes part of the permanent work order record. For Maintenance Supervisors concerned about workforce adoption of new technology, this is often the fastest win: technicians gain something they actually want, and the completion data arrives in SAP without a manual entry step. Innovaptive's AI-authored workflow conversion transforms existing paper procedures into digital work instructions, without requiring engineering teams to rebuild SOPs from scratch.
5. Digitize LOTO and Permit-to-Work Approvals
Digital PTW integrated with work orders allows permits to be initiated during work order planning, hours before the technician reaches the job site. The approving supervisor reviews and signs off electronically. The technician arrives at the job with permit in hand, clearance confirmed, and zero wait time.
In Oil and Gas and Chemical facilities where permit-required jobs dominate the daily schedule, this is not a marginal improvement. A facility running 20 permit-required jobs per shift, each carrying a 45-minute average PTW wait, is losing 15 hours of wrench time per shift to approval coordination alone. Digital PTW converts that wait into zero. Innovaptive's EHS module includes integrated permit-to-work capability tied directly to the work order lifecycle.
6. Deploy a Mobile-First Connected Worker Platform
The practical limitation of a desktop-only CMMS is that it ends at the office door. Everything from job dispatch to work completion to SAP update happens at a terminal, which means technicians either make multiple trips to interact with the system or they do not interact with it at all until the end of the shift.
A mobile-first connected worker platform moves the entire execution environment to where the work happens. Work orders arrive on a device. Parts and permit status are visible in the field. Digital checklists are completed at the asset. Task time captures automatically. Offline capability handles the vessel interiors, remote pump stations, and underground installations where cellular connectivity is unreliable.
7. Integrate SAP or ERP with Field Maintenance Execution
For enterprise organizations running SAP, the connected worker platform is only as effective as its SAP integration. A mobile work order system that requires manual synchronization with SAP creates a new version of the same problem it was meant to solve.
Native bidirectional SAP PM integration means work orders leave SAP and arrive on a mobile device without manual intervention, and completion data, confirmation, material consumption, failure notification, time entry, posts to SAP from the field in real time. The administrative loop closes at the job site. Innovaptive's 50+ prebuilt SAP integrations cover the full PM transaction set, which means deployment is configuration, not custom development. Organizations need to note that this is not a CMMS replacement. It is a field execution layer that extends the existing SAP investment to where the work actually happens, the job site, not the office.
Every Storeroom Trip Your Technician Takes Is a Planning Failure.
Learn kitting and staging best practices that get the right materials staged, confirmed, and ready before the job starts.
Download WhitepaperThe Wrench Time Debate: Is It the Right Metric?
Wrench time has legitimate critics. Some maintenance experts argue that measuring it encourages micromanagement and tracking the percentage of time a technician spends with tools in hand treats the symptom instead of the cause. This often leads to demotivation if used as an individual performance KPI for technicians.
When a wrench time study is announced without context, the message workers receive is simple: we are measuring how hard you work. For a technician who has spent half their shift waiting on parts that were never staged or permits stuck in a paper queue, being told that time does not count as productive work is demotivating. This is not paranoia. It reflects how the metric has historically been used.
"Low wrench time is almost never a technician problem. It is a planning problem, a parts problem, a systems problem, and the metric only has value when leadership treats it that way."
That said, the counterargument is equally valid. Without a measured baseline, improvement stays guesswork and investment approval stays out of reach. "Our technicians could be more productive" is not a business case. "We are at 32% wrench time and industry comparable is 55%, representing 8 technician-equivalents of recoverable capacity" is.
The resolution is straightforward: wrench time is most valuable as a diagnostic baseline, not a daily performance KPI. Enterprises should measure it once to understand their starting position. Then focus on improving operations: planning quality, parts availability, digital work execution, and system integration. Organizations that get this right do not talk about wrench time every day. They talk about planning schedule compliance, parts availability rates, and work order completion velocity. Wrench time improves as a consequence.
$4.7M in Downtime Savings. 30% Productivity Gains. Here's How Connected Workers Get There.
If SAP disconnection, manual work order handoffs, and field execution gaps are limiting your maintenance productivity, learn how a connected worker platform eliminates these gaps.
Download Connected Worker Guide
Unlock Margins Hidden in your Maintenance
Watch how leading manufacturers improve OEE, increase PM compliance, and reduce downtime through connected execution.

- 06-07-2026
11 Best Maintenance Management Software Tools
Maintenance technicians often spend only 25 to 35 percent of their shift on hands-on work.The rest...

- 03-07-2026
10 Best Connected Worker Platforms for Industrial Use
Connected worker platforms have evolved beyond digital forms and mobile inspections. Today,...

- 29-06-2026
Planned Maintenance Percentage: Formula & Benchmarks
Every hour a maintenance team spends reacting to breakdowns is an expensive missed opportunity;...