
What Is Maintenance Latency?
Maintenance latency is the time lost between an asset needing attention and useful work actually reaching it. It shows up as paid time that produces no repair, and it is one of the largest hidden drivers of maintenance cost in asset-intensive plants.
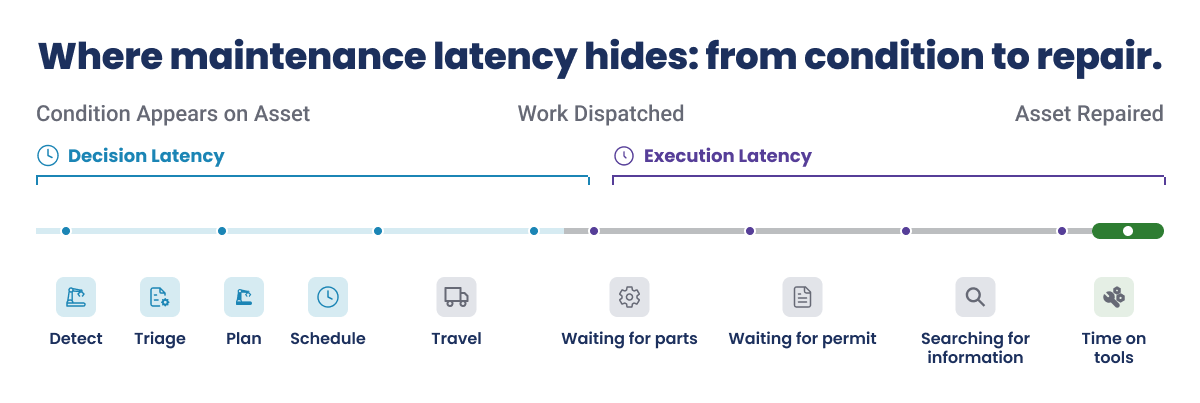
It has two parts, and they occur at different points in the process:
- Decision latency: the time from a condition existing on an asset to work being dispatched against it. It is measured in hours and days.
- Execution latency: the share of a paid maintenance shift that is spent on anything other than working on the asset.
A third form, learning latency, decides whether the plant fixes the same failure again next month.
Decision Latency: The Wait Before Work Even Starts
Decision latency is the elapsed time from the moment an asset starts behaving abnormally to the moment work is dispatched against it. The clock should start when the asset first shows the problem, not when someone finally creates a notification. That distinction matters, because the earliest part of the delay is usually the part nobody measures.
A single condition often travels through a chain of steps before any work begins:
| Condition → Detection → Triage → Planning → Scheduling → Crew Assignment |
Every step is a handoff, and every handoff is a chance for the work to wait. The cost is not only the delay itself. The longer a condition waits, the more a manageable problem tends to become a more expensive intervention. A minor seal weep becomes a bearing failure. A short planned repair becomes an emergency call-out at premium rates. Decision latency is where small problems are quietly upgraded into big ones.
Execution Latency: The Wait Inside the Shift
Execution latency is the share of a paid maintenance shift that is not spent working on the asset. It includes time spent:
- Travelling to the asset
- Waiting for parts
- Waiting for permits or isolations
- Searching for information
- Re-keying data
- Waiting for the area to become available
- Standing down because the job is not ready
Execution latency is often expressed through its inverse, wrench time or time on tools. Wrench time is the same shift measured the other way round: the higher the execution latency, the less of the paid shift actually turns into repair. Execution latency breaks into five measurable stages from detection through verified closure, which we cover in full in our guide to execution latency.
Why Fixing One Half Is Not Enough
Improving one type of latency on its own rarely improves the result. Suppose a plant sharpens its decision-making and dispatches work far faster. If the technician then spends half the shift waiting for parts, permits, or access, the plant has faster decisions and the same slow repairs.
The reverse fails too. A highly efficient maintenance crew makes little difference if work sits in a planner's queue for weeks before it is released. The savings come from closing both gaps, because maintenance cost builds up across the whole journey, not in one stage.
Your Plant Has the Insight. The Question Is How Fast It Becomes Action.
See how industrial AI moves from dashboards to the plant floor, and what the execution layer changes about maintenance cost and reliability.
Maintenance Latency Hides in the Handoffs Between Roles
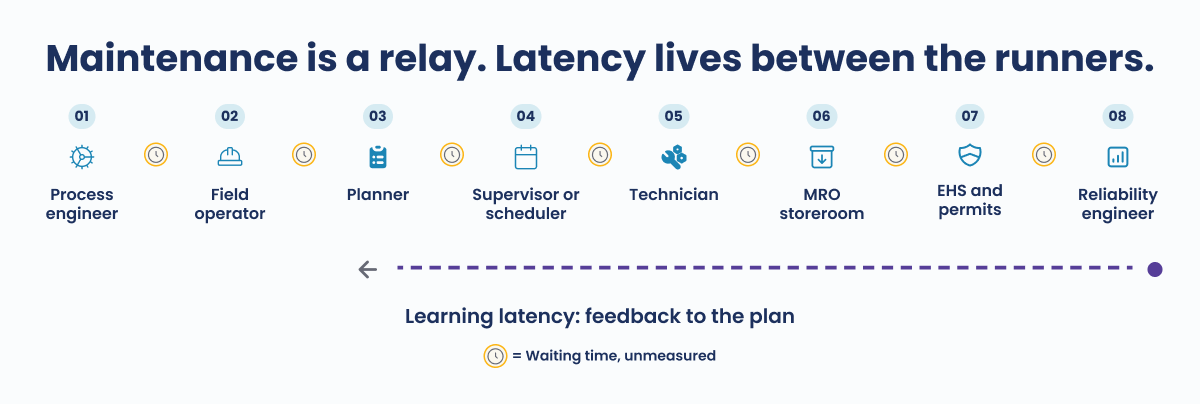
To see why both gaps persist, it helps to look at how maintenance work actually moves. Maintenance is not done by one role. It is a relay in which the work is passed from hand to hand across many people: the process or production engineer, the field operator, the planner, the supervisor or scheduler, the technician, the storeroom, the permit and EHS team, and the reliability engineer.
The important part is that latency usually forms at the exchanges between these roles, not inside them. The operator completes rounds. The planner clears the queue. The technician closes work orders. The storeroom processes material requests. Every individual metric looks reasonable. Yet no single dashboard shows the queue sitting between two people, and that queue is where the cost hides.
Maintenance Latency and TPM
Total Productive Maintenance, or TPM, established an important principle: maintenance belongs to every role, not just the maintenance department. Its pillars spread responsibility across the plant, with autonomous maintenance for operators, planned maintenance for planners, quality maintenance for process engineering, and safety activities for permit teams.
Each pillar can work well inside its own lane while work still gets delayed at the boundaries between lanes. TPM tells you who owns each activity. It does not, by itself, carry the work from one role to the next. That carrying is exactly where maintenance latency forms.
The Handoff That Runs Backwards: Learning Latency
The maintenance workflow has one step most plants skip: the feedback to the maintenance plan. Maintenance should not end when the technician closes the work order. The completed work, actual hours, failure codes, and lessons learned should flow back to reliability engineering and change the maintenance plan. This creates a feedback loop:
| Detect → Decide → Plan → Execute → Learn → Update the plan |
When the feedback never happens, the same assets keep failing while the plan stays frozen. That gap is learning latency. It is why some plants complete plenty of work yet never stop the repeat failures that drive their cost. The plant finishes the job but never learns from it fast enough to prevent the next one.
How Maintenance Latency Quietly Raises Cost
Once you can see the waiting, the next question is how does this impact maintenance cost. The analogy is simple: work that waits tends to become emergency work. Emergency work displaces planned work. The displaced planned work then becomes next month's emergency work. The cycle repeats, and the cost of both planned and reactive work keeps growing.
What makes it dangerous is that the usual maintenance KPIs can stay steady while this happens. In fact a backlog figure can fall while the real flow of work gets worse. Similarly a planned-versus-reactive split can look steady while spend rises underneath it. Holding a healthy PM-to-CM ratio depends on getting planned work done before it slips into reactive work, and latency is what makes it slip.
The cost shows up on several lines at once, and none of them is ever attributed to latency:
- Overtime to catch up on work that was delayed into premium hours.
- Contractor spend to backfill work the in-house team could not reach in time.
- Excess spare-parts inventory held as insurance against unreliable parts availability.
- Lost production when a small issue escalates into an unplanned outage while it waits.
Reattributing those lines to slow execution is what turns maintenance latency from a vague complaint into a defensible business case.
Maintenance Latency vs. Traditional Maintenance KPIs
Maintenance latency is not just a new name for backlog, MTTR, or wrench time. Each traditional KPI measures what happens inside a stage. Latency measures the waiting between stages, which is exactly what the others miss.
| KPI | What it measures | What maintenance latency adds |
|---|---|---|
| Maintenance backlog | How much work is outstanding | How long work waits at each stage, and where it waits |
| MTTR | How long a repair takes once it starts | The days that can pass before the repair even begins |
| Wrench time | The share of a shift spent on tools | The opposite side of execution latency: the share of the shift lost to waiting |
| Schedule compliance | Whether scheduled work happened | Why work failed to reach execution on time |
| OEE | Availability, performance, and quality | The upstream delay that erodes availability in the first place |
If Your KPIs Look Healthy but Costs Keep Rising, You Are Measuring the Wrong Thing.
This blueprint lays out how to build an AI-driven maintenance strategy that targets the waiting between stages, not just the work inside them.
How to Measure Maintenance Latency
Almost all plants do not need new sensors to start measuring maintenance latency. Most plants already have much of the required data in their maintenance and work management systems.
The challenge is that systems typically capture transactions, not every moment between them. You may know when a notification was created, when a work order was issued, and when it was closed, but not exactly when the problem was first detected, when the technician received the information, when parts were ready, or when work actually started.
That means measuring maintenance latency requires looking beyond individual transactions and examining the handoffs between detection, decision, and execution.
Here are six practical measures to start with:
| Measure | What it tells you | How to measure | Why the latency occurs |
|---|---|---|---|
| Detection latency | Whether the clock is being started at all | How often malfunction start and end times are filled in on notifications | Findings are logged at shift end, not when the problem is seen |
| Decision latency | How long demand waits before someone acts | Compare notification creation with the scheduled start on the linked order | The finding sits in triage and approval queues before dispatch |
| Execution latency | How much of a paid shift reaches the asset | See the detailed execution latency measurement methodology in our execution latency guide | Parts, permits, or access are not ready when the crew arrives |
| Backlog age | Whether planned work is stalling | Median age of open orders past their scheduled start date | Planned work keeps getting displaced by reactive work |
| Learning latency | Whether the maintenance plan adapts | Failure-coding rate, and the interval between repeat repairs on an asset | Closure data and failure codes are not captured or fed back |
| Actual vs. planned hours | Whether execution data is captured accurately | Compare confirmed hours against planned hours | Time on the job is estimated or entered late, not recorded live |
These measures can be derived from standard maintenance records in SAP. Equivalent data exists in supported systems such as IBM Maximo and Oracle. The method should be transparent enough that an analyst can reproduce the numbers.
What Would Maintenance Latency Look Like in Your Plant?
A short diagnostic, the Margin Walkthrough, uses your own operations and maintenance data to show where time is being lost across the process and what that waiting costs you.
What Maintenance Latency Usually Looks Like
So what do these numbers look like in practice? The figures below come from diagnostics Innovapptive has run in chemicals, refining, mining, and consumer goods plants. A diagnostic is a short, structured assessment that reconstructs a plant's own latency from its maintenance data and field observations.
These are observed measurements from those assessments, not published industry averages, and the plants that agree to a diagnostic often already suspect a problem. Read them as a starting point for your own questions, not as targets.
| Measure | Commonly observed | Healthy benchmark |
|---|---|---|
| Malfunction start recorded on notifications | Around 25% | Above 75% |
| Notification to work scheduled | Median around 9 days | Under 24 hours for breakdown work |
| Time on tools | Around 22% of a paid shift | 50 to 60% |
| Failure coding on completed corrective work | Around 10% | Above 60% |
| Maintenance overtime | Often above 15% | 5% or less |
| Schedule compliance | Around 70% | Above 85% |
| Reactive versus planned order cost | 5 to 6 times higher | Not applicable |
The point of these numbers is not to claim every plant looks like this. It is to prompt one question: where is time being lost in our own process?
How Indorama found $19M a year, starting with this exact diagnostic.
Indorama Ventures, a $15.4 billion global chemical producer, saw exactly this problem at its Port Neches, Texas facility. It already ran both SAP PM and IBM Maximo, yet frontline work was still paper-based and reactive. The maintenance backlog had stretched to 24 weeks, and fewer than half of all work orders were planned. After deploying Innovapptive's Connected Worker Platform to connect frontline execution back to those existing systems, the results within 12 months were clear:
| Metric | Before | After |
|---|---|---|
| Maintenance backlog | 24 weeks | 10 weeks (58% reduction) |
| PM-to-CM ratio | 45% | 80% |
| Parts availability | 55% | 95% |
| Inventory accuracy | 89.5% | 99.5% |
| Contractor headcount | 140 | 87 (38% reduction) |
| Maintenance overtime | 24% | 12% |
Together those gains delivered $19 million in realized EBITDA savings in 2025, with a further $50 million enterprise-wide opportunity identified as the model scales. None of it required replacing a core system.
See How Indorama Ventures Cut Its Maintenance Backlog by 58%
The same structured review that mapped Indorama's latency is where Innovapptive starts with every plant. See what it measures, and what it could surface in your operation, in the margin improvement report.
Why Has Maintenance Latency Been So Difficult to Solve?
Maintenance latency has persisted because most plants were never designed to manage the gaps between systems, teams, and decisions. ERP, EAM, analytics, and frontline tools each solve a specific part of the maintenance process. But when an issue moves from detection to decision to execution, the handoffs between those systems create delays that no single system owns.
The technology has evolved significantly over the past two decades. But it has evolved in layers, leaving the space between those layers largely unresolved.
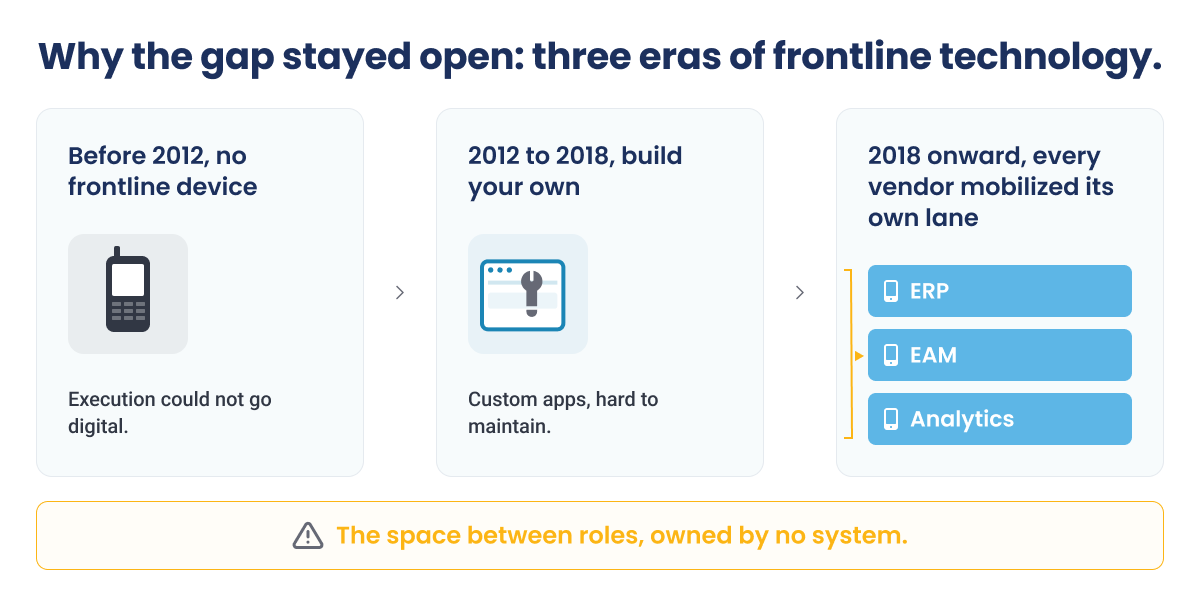
Three phases explain how we got here:
Before 2012: The Frontline Device Did Not Really Exist
Before smartphones reached enterprise scale, getting usable digital tools into the hands of frontline workers was hard. Rugged handhelds existed, but the experience and accessibility were limited. In practice, the layer where maintenance is actually executed had no easy way to go digital.
2012 to 2018: Companies Tried to Build It Themselves
As mobile app platforms matured, IT teams gained tools to build their own frontline applications, and many organizations did. The apps often worked, but the ongoing cost and complexity of maintaining them made the economics hard to justify, and most efforts stalled.
2018 Onward: Every Vendor Mobilized Its Own System
Then the major vendors added mobile access to what they already sold. ERP vendors mobilized ERP, EAM vendors mobilized EAM, and analytics vendors mobilized analytics. Each system served the lane it already owned, but the handoffs between those lanes still belonged to nobody.
That left an architectural gap. The problem was never really a shortage of technology. It was the absence of a single system responsible for the space between roles, which is exactly where maintenance latency lives.
The Missing Layer: From Insight to Action
Most industrial organizations have invested heavily in systems that generate information. Sensors detect abnormal conditions, analytics identify patterns, EAM systems create records, ERP systems manage transactions, and dashboards make performance visible. What almost none of them has built is the layer that carries a finding from insight to completed, verified work across every role in the relay.
Insight by itself does not create value. The value appears when the organization can move from detection to decision to execution to learning with less waiting between each step.The real question plant needs to ask is how quickly an insight becomes action, and answering it means measuring the handoffs between the systems and the people involved. A useful way to picture the journey is: insight, notification, work, parts and permit readiness, execution, closure, learning, and plan change. The latency between those steps is where hidden cost accumulates.
.png?width=1200&height=523&name=where-insights-stalls%20(1).png)
How Innovapptive Closes the Maintenance Latency Gap
Innovapptive is an industrial execution platform, also called a connected worker platform, that sits above your existing enterprise systems rather than replacing them. It is built to be that missing layer, connecting every role in the relay into one tracked flow:
- The operator spots the problem on operator rounds.
- The planner schedules the fix with planning and scheduling software.
- The permit team clears the work through an electronic permit to work software.
- The technician executes it on mobile maintenance software, guided by step-by-step digital work instructions.
It runs on mobile and works offline in the field, so the handoffs that used to live in radios and on paper become timed, visible steps. It integrates with SAP and supports systems such as IBM Maximo and Oracle, which means the intelligence a plant already paid for finally reaches the asset faster. Because the platform closes decision, execution, and learning latency together, the results compound.
Recognizing the depth of its execution capabilities, Innovapptive was named 2026 Company of the Year, Global Augmented Connected Worker Platforms by Frost & Sullivan.
Watch a Finding Go From Detection to Verified Fix Without a Manual Handoff.
See Innovapptive's execution layer run live on top of SAP or IBM Maximo, with no core system replacement.

Unlock Margins Hidden in your Maintenance
Watch how leading manufacturers improve OEE, increase PM compliance, and reduce downtime through connected execution.

- 05-10-2026
10 Best Shift Handover Software Platforms for Plant and Process Operations
Shift handover software can mean different things depending on the operating environment. Some...

- 29-09-2026
Best SAP Maintenance Planning & Scheduling Software 2026
Your maintenance work orders live in SAP Plant Maintenance (PM), while the working schedule lives...
- 28-09-2026
Best Work Order Software: Top 9 Platforms Compared
Selecting the best work order software is a different decision for a large industrial plant than...