What Is Planned Maintenance Percentage (PMP)?
Planned maintenance percentage is a critical maintenance KPI that measures the share of total maintenance labor hours spent on proactive, scheduled tasks. To accurately track this, it is essential to distinguish between planned and reactive work. Planned maintenance includes all work organized, documented, and scheduled before an asset failure occurs: this covers routine preventive inspections, time-based PM work orders, and condition-based or predictive servicing.
Reactive tasks include emergency repairs, breakdown responses, or any work order created after an unplanned equipment failure. Simply put: every hour spent on these reactive tasks directly drags your PMP percentage down.
Beyond simple time-tracking, PMP functions as a critical diagnostic tool. A low score is a clear warning sign that your maintenance capacity is being entirely consumed by failures you did not anticipate or control. This execution gap is the primary driver behind:
- Excessive Overtime Costs: Paying premiums for emergency labor and off-hours call-outs.
- Emergency Parts Premiums: Overpaying for expedited shipping and last-minute vendor procurement.
- Unscheduled Production Downtime: Halting operations and accumulating immediate P&L losses.
By diagnosing exactly where your reactive risk is concentrated, your team can finally break the cycle of crisis-driven maintenance and focus on building asset reliability.
The following section outlines the formula required to calculate your current PMP and establish your operational baseline.
Planned Maintenance Percentage Formula: How to Calculate PMP
PMP is calculated by dividing the total hours your team spends on proactive, scheduled maintenance tasks by their total maintenance labor hours, then multiplying by 100 to express it as a percentage. One critical rule teams must note while calculating PMP is to use labor hours and not work order count.
Planned Maintenance Percentage Formula
Where:
- Planned Maintenance Hours: Work scheduled in advance, before any failure occurred.
- Total Maintenance Hours: All hours logged in the period, both planned and unplanned.
You can determine your facility's PMP by dividing these planned hours by your total maintenance hours and multiplying by 100, figures you can either calculate manually or pull directly from your CMMS or ERP PM work order reports.
While PMP gives you a clear look at your proactive performance, you can get a complete view of your maintenance health by looking at the corrective maintenance (CM) ratio, which acts as the direct complement:
As you pull these numbers, keep one critical rule in mind: always use labor hours, not work order count. A two-hour preventive inspection and a ten-hour emergency breakdown repair carry very different operational weights; counting them as equal units will only mask your true reactive exposure and lead to inaccurate reporting.
How to Calculate PMP: Step-by-Step
To get a consistent view of your performance, follow this standard workflow:
- Define your calculation period: Select your calculation period, weekly, monthly, or quarterly. Monthly is the most common cadence for meaningful trend analysis.
- Extract total maintenance hours: Pull the total maintenance hours from your CMMS or ERP PM module, including every work order closed during that period, whether it was planned or unplanned.
- Identify planned maintenance hours: Filter total maintenance hours to identify only the maintenance hours that were scheduled in advance, specifically before any failure event took place.
- Apply formula: Divide your planned hours by the total hours, then multiply by 100 to arrive at your percentage.
Data quality warning: Your PMP is only as accurate as your CMMS data. Reactive maintenance teams capture only about 45% of actual work in their CMMS, compared to roughly 82% for high-discipline programs, based on industry benchmarking research on work order capture rates. Before tracking PMP, audit your last ninety days of work orders for completeness and correct categorization, miscategorized corrective work filed as planned maintenance will overstate your ratio.
Planned Maintenance Percentage Calculation Examples
The following examples demonstrate how different industrial environments apply the formula to assess their operational health:
- Example 1 — Manufacturing plant: Your team logs 600 total maintenance hours in a month, with 480 of those hours dedicated to scheduled tasks.
PMP Calculation: (480 ÷ 600) × 100 = 80%.
Status: This facility successfully meets the widely accepted 80% benchmark. - Example 2 — Oil and Gas field team: An O&G team logs 900 total hours, with 810 hours allocated to planned work.
PMP Calculation: (810 ÷ 900) × 100 = 90%.
Status: This team is operating at a world-class level for the O&G sector, where targets typically run 88–92% (estimated benchmark) due to high asset criticality and safety requirements. - Example 3 — Multi-site industrial operation: Across a quarter, a facility logs 2,400 total hours, with 2,040 hours spent on planned maintenance.
PMP Calculation: (2,040 ÷ 2,400) × 100 = 85%.
Status: This operation performs at a world-class level for manufacturing, meeting the 85%+ high-performer benchmark.
Each of these facilities meets or exceeds the 80% baseline, see the industry targets below to find the right standard for your specific sector.
What Is a Good Planned Maintenance Percentage?
An 80% PMP is the widely accepted industry benchmark, reflecting the classic 80/20 standard that governs maintenance program design across asset-intensive sectors. High-performing programs consistently clear this hurdle, with world-class facilities reaching 85% or higher.
Before chasing a perfect score, it is vital to understand that a PMP of 100% is neither realistic nor desirable. Because even the most mature facilities face unexpected events, a small reactive margin is expected. In fact, an extremely high PMP can often act as a red flag, signaling that failure data is being suppressed or miscategorized rather than reflecting a flawless operation. Most organizations typically fall into one of three performance tiers:
- Good performance: 80% PMP, the broadly accepted 80/20 baseline for proactive maintenance.
- Excellent performance: 82–85% PMP, consistently meeting the standard with a reliable margin of safety.
- World-class performance: 85% or higher, a proactive program defined by strong schedule compliance and a minimal emergency backlog.
Planned Maintenance Percentage by Industry
While the 80% benchmark provides a universal baseline, your specific target should be calibrated to the risk profile and regulatory demands of your industry. These are estimated benchmarks based on industry risk profiles. Ultimately, your specific target will vary based on asset criticality, regulatory environment, and the age of your equipment, so use these ranges as a strategic starting point rather than a fixed rule.
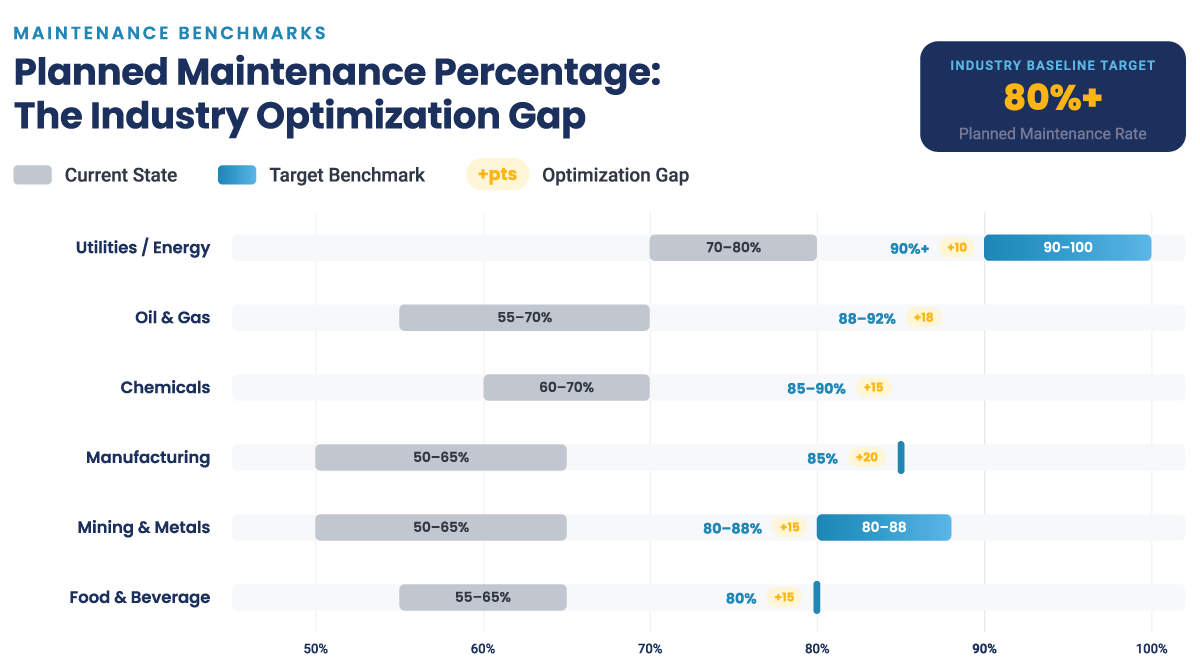
| Industry | Current PMP | Estimated Target PMP | Key Benchmark Driver |
|---|---|---|---|
| Manufacturing | ~50 to 65% planned | 85% | Production uptime and OEE targets |
| Oil and Gas | ~55 to 70% planned | 88 to 92% | Asset criticality, HSE compliance, high downtime cost |
| Chemicals | ~60 to 70% planned | 85 to 90% | Process safety, regulatory inspection requirements |
| Mining and Metals | ~50 to 65% planned | 80 to 88% | Equipment availability in remote, high-wear environments |
| Food and Beverage | ~55 to 65% planned | 80% | Compliance inspections add planned hours; temperature-sensitive assets create reactive risk |
| Utilities / Energy | ~70 to 80% planned | 90%+ | Stable, predictable operations; high asset standardization |
Estimated benchmarks based on industry risk profiles
Want To See What Proactive Maintenance Looks Like At Scale?
Download The Future of Maintenance: An Effective AI Blueprint to explore the strategies and technology stacks driving 90%+ schedule compliance and significant cost takeouts in asset-intensive industries.
Download WhitepaperHow to Improve Planned Maintenance Percentage
Improving your PMP is an exercise in shifting your team's focus from reactive firefighting to proactive reliability, a journey that follows four clear stages of operational maturity.
- Establish a PMP baseline: Begin by analyzing the last ninety days of your CMMS data to define your current ratio. You cannot improve a metric you haven't accurately measured, and this initial audit is the most effective way to identify if your current data is being distorted by incomplete records or poor categorization.
- Prioritize PM resources by asset criticality: Not all equipment carries the same operational weight. Use an asset criticality matrix to ensure your most vital production-critical and safety-critical assets receive the highest share of your planned maintenance hours, while lower-impact equipment is managed via optimized, extended, or condition-based intervals.
- Improve schedule compliance: A planned work order that remains uncompleted is a missed opportunity to shift the needle. By tracking schedule compliance alongside your PMP, you can determine if your low scores are the result of poor planning or an inability to execute the workload as scheduled.
- Close the mobile execution gap: A planned work order that goes uncompleted in the field counts against your PMP exactly the same as an unplanned breakdown. When technicians lack real-time work instructions, offline connectivity, or digital sign-off capability, even perfectly planned PMs slip through the cracks. Closing this execution gap, often by empowering teams with mobile-first digital workflows, is frequently the fastest way to move a stalled PMP.
Why PMP Matters: Benefits of a High Planned Maintenance Percentage
High PMP is more than a dashboard metric; it acts as a leading indicator of an organization's ability to control its operational costs, compliance posture, and production stability.
- Substantial reduction in unplanned downtime: By transitioning to a proactive schedule, teams catch asset degradation in its early stages before a minor fault escalates into a full-scale failure. Reliability research suggests that robust preventive maintenance programs can slash unplanned downtime by up to 18%. For asset-intensive facilities, this isn't just about avoiding a restart; it is about preventing the compounding losses across production throughput, technician labor hours, and component life that define reactive environments.
- Direct control over maintenance expenditure: The cost differential between reactive and proactive work is massive. Industry data consistently demonstrates that unplanned maintenance carries a cost premium three to ten times higher per work order than the same task performed on a planned basis. When work is scheduled in advance, your team can secure standard labor rates and order parts at list pricing. Conversely, emergency repairs trigger a cascade of hidden costs, including overtime, expedited shipping, and premium part procurement, that can derail a maintenance budget in a single quarter.
- Simplified compliance and audit readiness: In highly regulated sectors like Oil and Gas, Chemicals, and Food Processing, a high PMP serves as your strongest defense during a site inspection. Planned maintenance workflows generate a digital paper trail automatically, documenting exactly what was done, when, and by whom. By maintaining a high PMP, you ensure that evidence for safety audits, environmental compliance, and process safety management is already organized, eliminating the frantic scramble to reconstruct records after a failure.
- Superior budget predictability: Reactive maintenance is a variable cost that often consumes capital earmarked for long-term improvement projects. When your program operates at an 85% PMP, maintenance spend shifts from unpredictable expenses into stable, forecastable line items. This financial predictability grants Plant Managers the visibility required to move away from reactive crisis spending and toward strategic capital allocation, ensuring that your budget is directed toward building reliability rather than merely containing failure.
See How Indorama Ventures Improved Their Planned Maintenance to 80%
A 85%+ PMP is the engine behind predictable, low-cost operations. Learn how Indorama Ventures modernized their maintenance culture to eliminate reactive break-fix cycles.
Download the Full Case StudyWhy Most Teams Get Stuck: Root Causes of a High CM Ratio
If you have worked through the improvement steps and your CM ratio is still high, one of these five causes is usually the reason.
1. No Standard Process for Work Requests
When operators or supervisors request maintenance work verbally, by text, or on a sticky note, it bypasses the CMMS entirely. The work gets done, but it never becomes a work order, never gets categorized, and never shows up in your ratio. Over time, this informal work inflates your actual reactive exposure well beyond what the system reports. Every request must pass through a formal intake process and be converted into a categorized work order before action is taken.
2. Low Work Order Capture Rate
Industry benchmark data shows reactive maintenance teams capture around less than half of their actual work in the CMMS, while disciplined programs capture closer to 80%. If more than 30% of your maintenance activity is off-system, the PM ratio you are tracking is not your real PM ratio. It is just the ratio of the work that got logged. Fix the capture rate before you try to move the ratio.
3. No Asset Criticality Framework
Without a ranking system, every breakdown receives emergency priority. When non-critical repairs compete with production-essential assets, your planned PMs are consistently sidelined. Criticality rankings ensure your team focuses on the assets that actually stop production.
4. Aging Equipment with No Condition Monitoring
Aging equipment often fails between standard inspection windows. According to the 2021 Plant Engineering Annual Maintenance Survey aging assets are the leading cause of unplanned downtime at industrial facilities. Unless you supplement fixed-interval PMs with condition-based techniques, such as vibration analysis or thermography, these assets will continue to trigger reactive work.
5. The Field Execution Gap
A PM that is scheduled correctly but fails to close in the field is not just an execution but planning failure as well. Without digital work instructions or mobile sign-off capabilities, technicians are often forced to abandon scheduled tasks for urgent reactive calls. This is a classic execution failure: the schedule works, but the field delivery does not.
Planned Maintenance Percentage vs Related Maintenance KPIs
PMP does not function in a vacuum; it moves in a predictable relationship with several other critical maintenance KPIs. Tracking these metrics in tandem is the only way to determine if your reliability program is genuinely maturing or if specific operational levers are stalling your progress.
| KPI | What It Measures | Relationship to PMP | Direction When PMP Rises |
|---|---|---|---|
| Schedule Compliance | % of scheduled maintenance tasks completed on time | Leading indicator of PMP, low compliance means planned work isn't being executed, reducing PMP | Rises, more planned orders close as completed |
| MTBF (Mean Time Between Failures) | Average time between equipment failures | Higher PMP catches degradation earlier, extending time between failures | Rises, fewer unexpected failures |
| MTTR (Mean Time to Repair) | Average time to complete a repair | Planned maintenance includes documented procedures, so technicians arrive prepared and repair faster | Falls, faster, better-prepared repairs |
| OEE (Overall Equipment Effectiveness) | Availability × Performance × Quality | Unplanned downtime reduces availability, which reduces OEE; higher PMP protects OEE by preventing breakdowns | Rises, improved asset availability |
| Maintenance Backlog | Volume of outstanding work orders | A growing backlog reduces capacity for planned work, pulling PMP down | Falls, more planned work executed, less queued |
These five KPIs are most useful when tracked together in a live dashboard rather than pulled separately at month-end. Platforms like Innovapptive's Smart Analytics, which surface PMP alongside MTBF, MTTR, and schedule compliance in one view, give maintenance managers a complete picture of program health, with the ability to act on trends before the month-end ratio is locked in.
How Innovapptive Improves Planned Maintenance Percentage
Bridging the gap between a high-level scheduling strategy and daily field performance is where most maintenance programs stall. For asset-intensive organizations relying on SAP PM or IBM Maximo, Innovapptive's Connected Worker Platform acts as the operational layer that transforms static PMP targets into active, daily execution.
Maintenance Insights: Track PMP in Real Time
A monthly PMP report is a lagging indicator that only confirms where you went wrong; a real-time dashboard provides the live management signal needed to pivot before a bad week becomes a missed monthly target. By unifying PMP, MTBF, MTTR, and schedule compliance into a single interface, maintenance leaders can transition from reporting mode to intervention mode. Instead of reviewing month-end data, managers can immediately identify which specific assets are driving corrective work spikes this week or which shifts are struggling to complete their assigned PMs. Maintenance Insights provides this visibility in real time. This proactive visibility is how customers using Innovapptive's platform consistently reach schedule compliance levels of 90% or higher.
Mobile Maintenance: Closing the Field Execution Gap
As we noted in our improvement framework, a planned work order that remains uncompleted in the field is a major PMP drain, it essentially equates to an unplanned breakdown in your data. Even with perfect planning, technicians often struggle when they lack digital work instructions or cannot process sign-offs in real-time. Innovapptive's Mobile Maintenance module changes this dynamic by digitizing the execution process, providing technicians with offline-capable instructions via RapidSync™ to ensure that work stays on track even in remote or connectivity-poor areas. By ensuring that planned tasks are consistently finished within the scheduled window, teams reclaim their PMP, a key driver in the 20 to 30% unplanned downtime reductions reported by our customers.
AI-Guided Planning and Scheduling
A calendar that looks full on paper is useless if it doesn't account for real-world constraints like parts availability or skill-level matching. Innovapptive's WorkSmartAI optimizes your planning logic, automatically balancing shift workloads and ensuring materials are ready for the frontline.
By leveraging Spare Parts Kitting and Staging parts accuracy is confirmed before the maintenance window opens, rather than finding shortfalls once a technician is already at the job site. This ensures that every kitted item scanned updates the ERP reservation in real time, while unstaged items return to available stock automatically, eliminating the manual translation errors that typically plague planning.
This level of precision is what drives measurable impact; for instance, at Indorama Ventures, deploying our Connected Worker Platform was a strategic lever that helped shift their culture from reactive break-fix to predictive maintenance, improving their PM-to-CM ratio from below 50% to over 80%. By streamlining this planning friction, teams drive more PMs to complete status, which translates to a 10 to 15% reduction in total maintenance spend without the need to hire additional personnel.
Stop Reactive Maintenance: Unlock 20–30% Less Unplanned Downtime
When you close the execution gap, your bottom line responds. Innovapptive helps organizations drive 5–15% EBITDA growth by moving from reactive cycles to peak performance.
Schedule a Personalized Demo
Unlock Margins Hidden in your Maintenance
Watch how leading manufacturers improve OEE, increase PM compliance, and reduce downtime through connected execution.

- 06-07-2026
11 Best Maintenance Management Software Tools
Maintenance technicians often spend only 25 to 35 percent of their shift on hands-on work.The rest...

- 03-07-2026
10 Best Connected Worker Platforms for Industrial Use
Connected worker platforms have evolved beyond digital forms and mobile inspections. Today,...

- 29-06-2026
Planned Maintenance Percentage: Formula & Benchmarks
Every hour a maintenance team spends reacting to breakdowns is an expensive missed opportunity;...