
What Is a Maintenance Backlog?
A maintenance backlog is all the maintenance work that has been identified and approved but not yet completed. It includes preventive tasks waiting for their scheduled window, corrective work orders from breakdowns, and inspection findings that are logged but not yet acted on.
Here is a simple example. A pump bearing replacement is approved and the parts are on order, but no technician has been assigned. That open work order sits in the backlog until the job is done and closed.
A thing organizations should note is that the word backlog means different things in different fields. In software, an Agile or Scrum product backlog is a ranked list of features a team plans to build. A maintenance backlog has nothing to do with that.
Planned vs. Unplanned Backlog
Not every backlog item is overdue or reactive. Planned work is preventive maintenance that is scheduled but has not yet reached its execution window. Unplanned work is corrective activity from breakdowns or inspection findings.
Both types count toward the total, and the mix matters: a queue made up mostly of planned work points to a scheduling issue, while one dominated by corrective work points to a reliability issue. The formula in the next section uses the combined total, but you should always track the split.
How to Calculate Your Maintenance Backlog (Formula and Backlog Ratio)
A maintenance backlog is calculated by dividing the total hours of outstanding, approved maintenance work by the hours your team has available to work each week. The result tells you how many weeks it would take to clear the queue at your current pace.
|
Maintenance Backlog Formula Maintenance Backlog (weeks) = Total Backlog Hours ÷ Available Maintenance Hours per Week |
Here is a quick example. Say you have 1,600 hours of open, approved work, and your team has 400 hours of maintenance capacity each week. Your backlog is 1,600 ÷ 400 = 4 weeks. That is four weeks of work already waiting, before a single new job comes in.
So backlog weeks answers one question: at your current capacity, how long would it take to clear every open job if no new work arrived? In practice it never reaches zero, because new work always arrives. The number still tells you how far behind you are, and whether that gap is safe.
Backlog Ratio
Backlog weeks tells you how deep the queue is today. It does not tell you which way it is heading. For better direction, organizations should compare the new work arriving each week against the work your team can finish that week. That comparison is the backlog ratio.
|
Backlog Ratio Formula Backlog Ratio = New Work Hours Received per Week ÷ Available Maintenance Hours per Week |
A ratio of 1.0 means work arrives exactly as fast as you clear it, so the backlog stays flat. Above 1.0, more comes in than goes out, so the backlog grows. If it is below 1.0 then you are catching up.
Backlog Hours vs. Backlog Weeks: Which Metric to Use
Backlog hours is the raw number: the sum of estimated labor hours across every open work order. Backlog weeks takes that number and divides it by real weekly capacity, which makes it easy to compare across teams or sites.
Organizations should use hours when they plan schedules at the technician level and should use weeks when reporting to plant management or leadership. We have 3,200 backlog hours is hard to act on. We are at an 8-week backlog lands right away. Weeks translate into business terms faster.
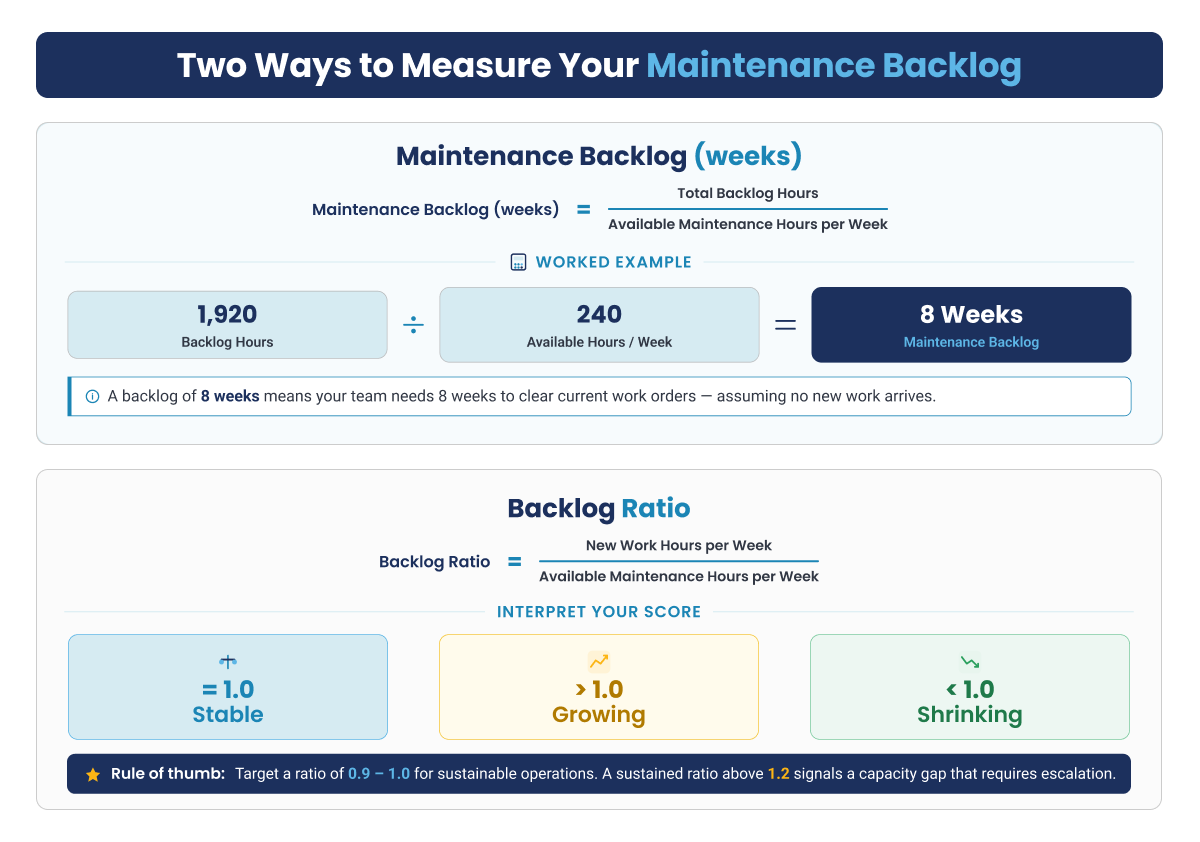
Worked Example: Calculating Backlog for an 8-Technician Crew
Take a crew of 8 technicians. Each works 40 hours a week, but only about 30 of those go to hands-on maintenance after meetings, travel, and admin. That gives 240 available maintenance hours per week.
Now add up the estimated hours on every open work order. Say that total is 1,920 hours. Divide the backlog hours by the weekly capacity to get the backlog in weeks.
| Input | Value |
|---|---|
| Total open backlog hours | 1,920 hours |
| Number of technicians | 8 |
| Available hours per technician per week | 30 hours |
| Total available capacity per week | 240 hours (8 × 30) |
| Backlog in weeks | 1,920 ÷ 240 = 8 weeks |
At 8 weeks, this crew sits above the usual healthy range. These numbers suit a mid-size site. A large plant with hundreds of technicians will show far higher raw hours, which is exactly why the benchmark is expressed in weeks, not hours.
Calculate Your Backlog In Minutes
Download the free Maintenance Backlog Template. The backlog weeks and backlog ratio formulas are built in, alongside a work order log and a four-tier prioritization tab.
How Much Is A Healthy Maintenance Backlog?
For most maintenance teams, the standard benchmark is 2 to 4 weeks. That range gives planners enough buffer to schedule work efficiently, without letting jobs sit long enough to become a safety or reliability risk.
In practice, the healthy range shifts with the type of operation.
| Industry / Operation Type | Typical Healthy Backlog Range |
|---|---|
| Food and beverage / Pharmaceutical | 1 to 2 weeks (high regulatory sensitivity) |
| General manufacturing | 2 to 3 weeks |
| Utilities / Municipal facilities | 3 to 4 weeks |
| Mining and heavy industry | 4 to 6 weeks (larger equipment, longer lead times) |
*These ranges are directional.
Organizations should treat these as reference points, not a pass or fail grade. The trend and the makeup of the backlog matter as much as the raw number.
Using Maintenance Backlog as a KPI
Backlog size in weeks is a standing KPI in most mature maintenance organizations. However, it rarely stands alone. Organizations should track it next to PM compliance (the share of preventive tasks done on time), schedule compliance, and wrench time. A rising backlog is often the first of these to move, which makes it an early warning for the others. It is important to note that both backlog weeks figure and ratio numbers should be reported together so leadership sees both depth and direction.
Why the 2-to-4-Week Rule Doesn't Always Apply to Large, SAP-Integrated Operations
The 2-to-4-week benchmark was built for small and mid-size sites, not for multi-plant enterprises running thousands of concurrent work orders inside SAP or IBM Maximo. At that scale, approval routing, parts procurement lead times, and fixed shutdown windows add complexity a small team never deals with.
A well-run enterprise sitting at 8 to 10 weeks can be in better shape than a small site at 3 weeks with poor PM compliance and no prioritization. One global chemical producer reached a well-managed state of around 10 weeks after a sharp reduction from a much higher starting point. So organizations should use the standard benchmark as a starting reference, not a scorecard.
Is a Zero Maintenance Backlog a Good Sign?
No. A zero backlog almost always signals a problem, not strong performance.
If backlog hits zero, one of two things is usually happening. Either inspections and PMs have stopped producing findings, or jobs are being closed before they are actually done. Both create a false picture of a clean queue.
A healthy program keeps generating work. Inspections find defects, PMs surface wear, audits flag gaps, and all of it enters the backlog. If nothing is entering, the work is either not being done or not being recorded. Either is worse than carrying a backlog.
This is the opposite of the Agile world, where an empty product backlog can mean a team finished its roadmap. In maintenance, an empty backlog is a red flag. Organizations should keep 2 to 4 weeks of planned work visible at all times.
Read more: How AI is moving maintenance from reactive to predictive
What Causes a Maintenance Backlog to Grow Out of Control
A maintenance backlog grows for one underlying reason: the demand for maintenance work exceeds the capacity available to complete it. Demand is variable, since breakdowns arrive in clusters, planned shutdowns compress the schedule, and inspections can generate findings faster than the team can act on them. Capacity, by contrast, is largely fixed in the short term. The backlog is where that gap accumulates.
While the pattern is consistent, the specific drivers that usually increase maintenance backlog fall into three major categories:
1. Labor and Spare Parts Constraints
Insufficient technician headcount is the most visible constraint, but spare parts availability is often the larger and less obvious one. A work order can be fully planned, scheduled, and assigned, yet still stall if the required parts are not on hand.
Parts-waiting jobs also distort your backlog metrics. Because the work is planned on paper, it counts toward the total and can appear ready to execute when it is not. The result is a backlog that reads as both larger and more actionable than it really is.
The remedy is to separate the total backlog from ready-to-schedule backlog, the portion where parts are confirmed and permits are in place. Parts-waiting jobs should be tagged separately so they do not distort scheduling decisions. Operations that confirm materials before a job is scheduled, rather than after, consistently clear backlog faster and report a more accurate figure.
This is also where disciplined materials management makes the difference. Spare parts kitting and staging assembles and reserves the parts for each job before it reaches the schedule, and mobile inventory and warehouse management gives planners and technicians real-time visibility of stock across sites. Together they ensure that work counted as ready to schedule is genuinely ready to execute.
2. Poor Work Order Prioritization and Scheduling
Without a formal ranking system, work tends to be sequenced by the urgency of the request rather than by actual risk. Jobs that are escalated most forcefully move to the front of the queue, while higher-risk work with no active advocate remains deeper in the backlog. Over time, lower-priority requests displace safety-critical and reliability-critical tasks.
The remedy is a structured prioritization method. Until this method is in place, planners rebuild the daily schedule reactively instead of executing a stable, ranked plan.
Sustaining that ranked plan is easier with purpose-built tools. Innovapptive planning and scheduling applies criticality-based priority across the backlog and builds a stable weekly schedule, while mobile maintenance puts that schedule and each work order in the technician's hands in the field, so execution follows the plan rather than daily improvisation.
3. Weak or Missing Preventive Maintenance
A weak preventive maintenance (PM) program compounds the problem over time. As PM compliance declines, equipment deteriorates and fails more frequently. Each additional breakdown generates corrective work, which consumes the hours intended for planned PM. Less PM then leads to more failures, and the cycle repeats. This self-reinforcing pattern is commonly called the reactive death spiral, and it is the most frequent reason a backlog moves beyond control.
The metric to monitor is the PM ratio: the share of maintenance work that is planned rather than reactive. A PM ratio below 50 percent is a strong indication that the PM program is weak.
Balancing Reactive Repairs and Preventive Work
Breaking this cycle depends on protecting planned capacity. When most available hours are consumed by reactive repairs, PM is deferred and the backlog continues to grow. The practical countermeasure is to reserve a fixed percentage of weekly capacity for planned PM and to protect it, even during periods of heavy reactive demand.
Many high-performing plants target a work mix of roughly 80 percent planned and 20 percent reactive. Reaching that balance takes time, but protecting those PM hours is what prevents the backlog from continually feeding itself.
Read More: Detailed Guide on Improving PM Ratio
How to Prioritize a Maintenance Backlog
Not all backlog work is equally urgent. Treating a routine inspection finding the same as a failed pressure relief valve is a planning failure, not a resource problem. A tiered model fixes this by sorting work into clear categories with defined response windows.
The model below works on a spreadsheet without any special software, though a connected work order system makes the process seamless by automating categorization against live asset data based on these criterias.
| Tier | Criteria | Target Clearance Window |
|---|---|---|
| Tier 1: Safety and Compliance Critical | Risk of injury, regulatory violation, or permit breach if deferred. Includes pressure systems, safety interlocks, and lockout/tagout findings. | Immediate to 24 hours |
| Tier 2: Asset Criticality and Failure Risk | Work on high-criticality assets where failure stops production or triggers other failures. Set by asset criticality ranking. | Within the current week |
| Tier 3: Condition Deterioration Risk | Findings showing active wear but not yet at failure. Deferring raises repair cost and risk. | Within the current or next PM window |
| Tier 4: Planned Improvement | Efficiency upgrades, minor repairs, and low-criticality work with no near-term consequence if deferred. | Next planning cycle |
Strategies to Prioritize Safety-Critical Tasks
Tier 1 work should never wait behind Tiers 2 through 4, no matter how long lower-tier jobs have been open. A few rules to follow are:
- Give safety and compliance findings an automatic Tier 1 flag when they are created, not during review.
- Assign a named owner and a target date to every Tier 1 item the day it is raised.
- Never let backlog age override criticality. A Tier 1 item open for one day outranks a Tier 4 item open for six months.
- Review open Tier 1 work in a short daily stand-up, separate from the weekly backlog review.
See Prioritization Run On Live Asset Data
Take a self-guided tour of the Connected Worker Platform and watch work orders get scored, scheduled, and executed in real time.
Step-by-Step: How to Reduce and Manage Your Maintenance Backlog
Reducing a backlog works best as an ordered sequence rather than a set of parallel efforts. The five steps below build on each other: clean the data first, prioritize work orders, plan and schedule work orders carefully, support it with the right system and technology, and then address the causes that created the backlog. Working them out of order, such as prioritizing before cleaning data, wastes effort on work orders that should not be in the queue at all.
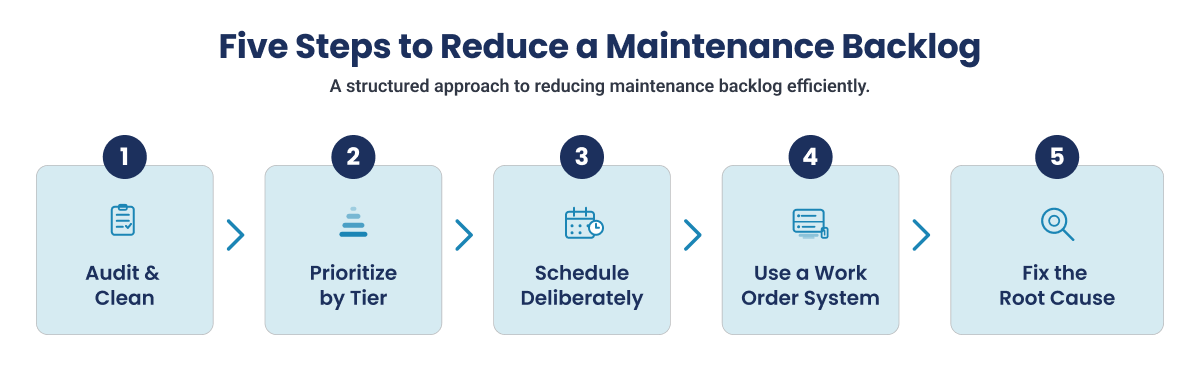
- Audit and clean the backlog first: Before organizations score or schedule any work orders they should close out jobs that are finished but not marked closed, and remove duplicates. A large share of most backlogs are stale entries that inflate the number without representing real work.
- Prioritize with the tier model: Organizations should apply the four tiers given above based on safety and compliance, asset criticality, condition based risks and low critical tasks and decide work order priority. Flag every Tier 1 item first and confirm it has an owner and a target date.
- Plan and schedule deliberately: A work order should be moved into the schedule only when it is truly ready: parts on hand, permits cleared, technician assigned. Scheduling half-ready jobs is what causes daily plan breaks.
- Use a CMMS or connected work order system: Spreadsheets work at small scale but break down with high volume, multiple sites, or SAP integration. A work order system scores priority, surfaces overdue items, and keeps the count accurate in real time.
- Fix the root cause: Clearing the queue without addressing why it filled up leads to repeat issues. Organizations should conduct a root cause analysis.
The three steps given below play a major role in deciding if the the backlog meets the benchmark:
1. Audit and Clean Up Stale or Duplicate Work Orders First
A phantom work order is a backlog entry that does not represent real, open work. There are two common kinds: jobs already completed but never closed in the system, and duplicates created when a stalled job gets re-raised. Both inflate the backlog and waste planning effort.
Organizations can identify these by:
- Sort by age with no recent activity: Anything sitting untouched past a set threshold is a candidate for review.
- Cross-check open jobs against completion records: Work marked open but done in the field is a phantom to close.
- Search for duplicate asset and description pairs: Repeated entries on the same asset usually mean a job was re-raised, not doubled.
- Flag work orders with no estimated hours and no owner: These are often abandoned entries.
Organizations should run this as a scheduled monthly audit rather than a one-time purge. Clearing phantoms often cuts the reported backlog right away, with no field work at all.
2. Schedule Deliberately Within Existing PM Windows
One of the least expensive ways to clear a corrective backlog is to batch it with PM work already scheduled on the same asset or area. If a pump is coming offline for a quarterly inspection, adding a Tier 3 corrective job to that same window costs almost no extra downtime and avoids a second contractor mobilization.
This is a scheduling principle first, not a software feature. On a spreadsheet, it means checking open backlog items against the next PM schedule before finalizing the plan. A connected work order system can match them automatically.
Read more: Practical ways to reduce maintenance costs across your operation
3. Address Root Causes, Not Just the Symptom
Clearing today’s backlog without fixing the underlying gap just refills the queue. Teams that run a reduction sprint but never raise PM compliance or fix parts availability usually see the backlog return to the same level within 8 to 12 weeks.
Organizations should match the fix to the cause. If the root cause is a low PM ratio, rebuild the PM program. If it is parts availability, run an inventory accuracy and min/max review. If it is poor prioritization, put the tier model to work. A sprint without an input fix is only a temporary win.
However, identifying that cause reliably calls for a structured method rather than assumption. A repeatable technique such as 5-Why analysis traces a recurring failure back to its origin, so the corrective action addresses the source instead of the symptom, and the backlog does not simply rebuild.
Build Your AI Maintenance Blueprint
Discover how asset-heavy operations can leverage AI agents to move from a reactive backlog to predictive, connected maintenance.
How a Connected Work Order System Reduces Maintenance Backlog at Scale
Most maintenance management software can track and score work orders, which helps a smaller operation stay organized. At enterprise scale, the harder problem is different. When the system of record is SAP or IBM Maximo, the backlog is only as reliable as the field data flowing back into it. If execution data lags, the backlog figure itself becomes untrustworthy, and every decision based on it inherits that error.
Consider a technician who completes a job in the field and records it on paper, with the closure entered into SAP two or three days later. For those few days, the backlog count overstates the real open work. Across hundreds of technicians and thousands of work orders, that lag compounds. Planners allocate resources against inflated numbers, and priority decisions rest on information that is already out of date.
This is the gap the Innovapptive Connected Worker Platform is built to close. It operates as an OT-IT execution layer between SAP or Maximo and the frontline technician. Work orders are delivered to mobile devices, and completions, meter readings, and inspection findings flow back into the system of record in real time, including when technicians work offline in the field. The backlog then reflects what is actually open, not what was open several days earlier.
Two capabilities make that possible. Integration Manager maintains a bidirectional connection to SAP or Maximo, so a work order closed in the field updates the system of record without manual re-entry or delay. RapidSync offline mode lets technicians capture completions, readings, and findings in areas with no signal. The data syncs automatically once connectivity returns, so remote or shielded assets do not create a hidden lag in the backlog.
Ready To Reduce Your Own Backlog?
Book a personalized demo and see how Innovapptive connects your frontline to SAP or Maximo to cut backlog at scale.
Real-World Result: Cutting a Maintenance Backlog by 58 Percent
Indorama Ventures, a $15.4 billion global chemical producer, cut the maintenance backlog at its Port Neches, Texas operation by 58 percent, from 24 weeks to 10, without adding headcount. The gains came from connecting frontline execution to its SAP and IBM Maximo systems of record, digitizing paper-based work orders, and closing the reactive maintenance gap that had kept the backlog high.
The impact reached beyond the backlog itself. Within 12 months, the same program moved the operation from a reactive maintenance culture to a planned one, with measurable gains in parts availability, preventive maintenance, and inventory accuracy.
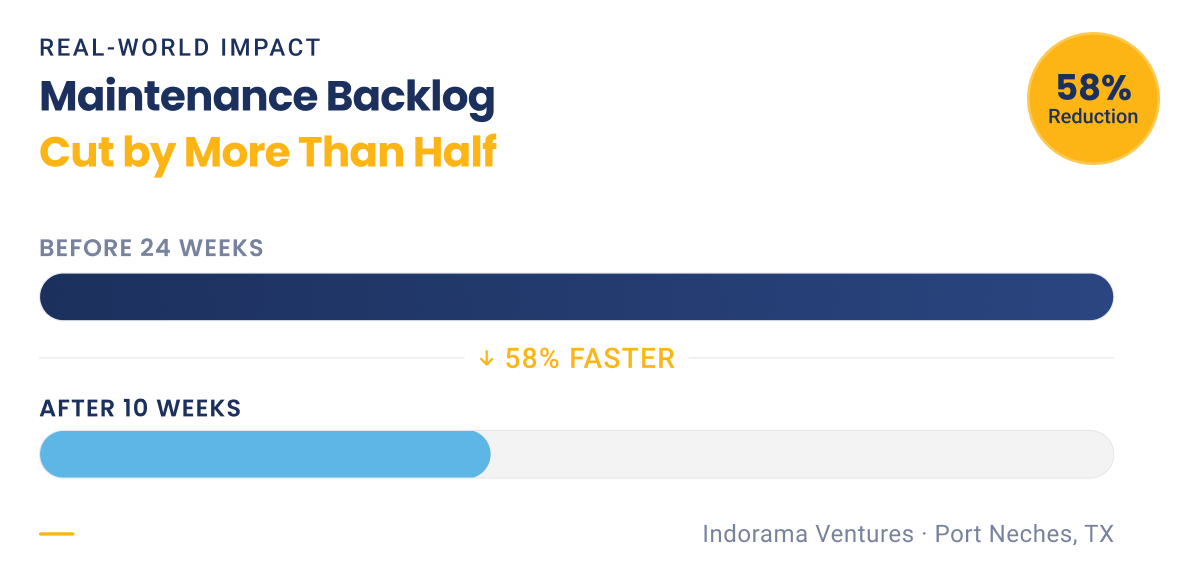
Together, these changes delivered $29 million in realized EBITDA savings in 2025, part of an estimated $50 million cost-takeout opportunity as the model scales across the wider enterprise.
|
Indorama Ventures: Key Results
|
See How Indorama Cut Its Maintenance Backlog by 58%
Read the full case study on how a $15.4B chemical producer cut its backlog from 24 to 10 weeks and unlocked $29M in EBITDA savings.

Unlock Margins Hidden in your Maintenance
Watch how leading manufacturers improve OEE, increase PM compliance, and reduce downtime through connected execution.

- 23-10-2026
Maintenance Planning and Scheduling: The Ultimate Guide
A mechanical crew reaches a boiler feed water pump at 7 a.m. to change a bearing, then waits three...

- 21-10-2026
10 Best Work Instructions Software: Compared and Reviewed
Choosing work instructions software is about more than turning a PDF into guided steps on a tablet....

- 15-10-2026
Maintenance Digitalization: A Digital Transformation Guide
Maintenance digitalization is the shift from paper, spreadsheets and disconnected tools to...