What Is PM Ratio and CM Ratio in Maintenance?
PM ratio (preventive maintenance ratio), is the percentage of your total maintenance labor hours that goes to planned, scheduled work. CM ratio (corrective maintenance ratio) on the other side denotes the share of maintenance hours spent on work that was not planned in advance. Taken together they showcase your maintenance effectiveness ratio. If your PM ratio is 65%, your CM ratio is 35%, the two should always add up to 100%.
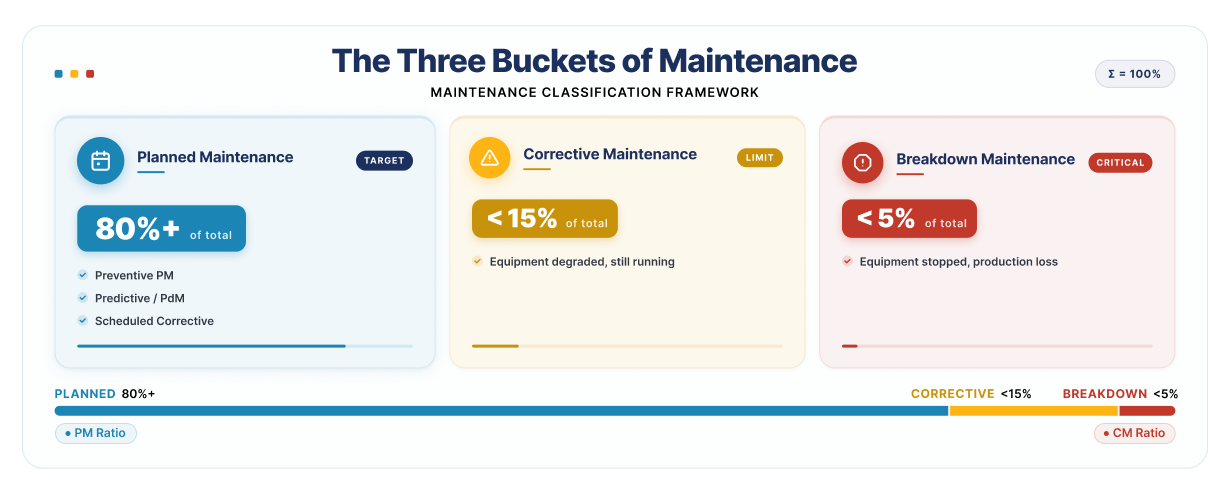
Most maintenance teams think in two buckets: planned vs unplanned. In practice, there are three types of maintenance work:
- Planned Maintenance (80% or more): Scheduled PMs, predictive maintenance tasks, and pre-arranged repairs.
- Corrective Maintenance (Below 15%): Addressing equipment that has started to degrade but is still running; catching early warning signals to schedule a fix before failure.
- Breakdown Maintenance (Below 5%): Reactive work required when equipment stops completely and demands an immediate response.
For a detailed breakdown of how each category affects your ratio and how to set them up correctly in your CMMS or SAP PM module, see the comparison section below.
The 80/20 Maintenance Rule: Ideal PM to CM Ratio and Benchmarks
The 80/20 rule is an industry-standard maintenance benchmark for asset-intensive operations: 80% of maintenance labor hours should be dedicated to planned work, with no more than 20% on corrective or breakdown repairs. This balance is critical because planned work is significantly cheaper and more efficient than reactive troubleshooting. By prioritizing scheduled maintenance, you prevent reactive maintenance culture, where every emergency repair displaces a preventive task, directly increasing the likelihood of future unplanned failures.
The gap between the 80/20 target and where most asset-intensive facilities actually operate is wide. It is common for plants running on a reactive culture to operate with a PM-to-CM ratio below 50%. That is not a minor inefficiency. It shows up as higher maintenance spend, longer backlogs, and equipment unavailability. Closing that gap to 80/20 requires structured changes to how work is captured, scheduled, and executed in the field.
PM Ratio Benchmarks by Industry
The table below shows where high-performing maintenance programs across industries target their PM ratio, based on industry-wide benchmarking research and the operational risk, regulatory exposure and safety risk of each industry that typically drive tighter maintenance discipline in those environments.
| Industry | Estimate Current State PM Ratio | Target PM Ratio | What Drives the Target |
|---|---|---|---|
| Manufacturing | ~36 to 50% | 85% | Overall Equipment Effectiveness (OEE), throughput consistency |
| Oil and Gas | ~30 to 45% | 88 to 92% (estimated) | Safety, HSE compliance, regulatory requirements |
| Chemicals | ~35 to 50% | 85 to 90% (estimated) | Process integrity, environmental compliance |
| Mining and Metals | ~30 to 45% | 80 to 88% (estimated) | Equipment availability, remote site operations |
| Food and Beverage | ~40 to 55% | 80% | Food safety regulations, sanitation schedules |
| Utilities / Energy | ~40 to 50% | 90%+ | Grid reliability, regulatory inspection requirements |
Figures are estimated benchmarks based on industry risk profiles and regulatory exposure.
In reality, many facilities with reactive cultures struggle to exceed 50% planned work. The path to world-class maintenance performance does not lie in expanding your team size. Instead, it requires fixing the underlying process and execution gaps that prevent effective scheduling.
How to Improve Your PM Ratio: A 5-Step Framework for Manufacturing
Most facilities improve their PM ratio by following these five sequential steps. You cannot optimize what you do not measure, and you cannot sustain gains without the right execution tools.
Step 1: Establish a Baseline Using Your Last Ninety Days of Work Order Data
Start with what your CMMS or ERP PM module shows you. Pull closed work orders from the last ninety days and calculate your current ratio: total planned maintenance hours divided by total maintenance hours, multiplied by 100. Calculate your ratio using labor hours, not work order counts, a ten hour emergency repair is not equivalent to a thirty minute inspection. If less than 70% of your total work is captured in the system, your baseline is inflated. You must solve the missing data problem before you can trust your ratio.
Step 2: Audit Your Work Order Categories
Your ratio is only as good as your data integrity. Many teams accidentally inflate their PM ratio by mislabeling corrective work as planned. Audit your last ninety days work orders against a simple three-bucket model: planned, corrective, and breakdown. Even a 10% miscategorization rate can mask a failing maintenance program.
Industry data shows reactive maintenance teams capture only about half of actual work in their CMMS, versus around 82% for high-discipline programs. If over 30% of your work happens off-system, your metrics are unreliable.
Step 3: Build an Asset Criticality Matrix
Don't treat all assets equally. Use an asset criticality matrix to rank equipment based on production impact, safety risks, and repair costs. Once ranked, redirect your PM hours to your tier 1 assets (those that stop production upon failure). For low-risk equipment, consider stretching intervals or moving to condition-based monitoring to free up capacity for critical tasks.
Step 4: Fix the Field Execution Gap
A scheduled PM that remains incomplete in the field does not count as planned work. When technicians lack digital work instructions or cannot process sign-offs in real-time, planned jobs often slip, close as incomplete, or get displaced by emergencies.
Innovapptive's Mobile Maintenance helps bridge this gap. By delivering digitized work instructions directly to a technician's mobile device, these tools ensure that planned tasks remain the priority, significantly increasing the volume of PMs completed within the scheduled window.
Step 5: Track PM Ratio Weekly, Not Monthly
A monthly PM ratio is a lagging indicator that hides problems until it is too late to react. Adopt a weekly planning cadence to review schedule compliance, identify which assets drove the most corrective work, and adjust the following week's plan accordingly. This tight feedback loop allows you to make course corrections before a small trend becomes a major failure.
Real-World Proof: Indorama Ventures Moved From 45% to 80% PM-To-CM Ratio in 12 Months
Indorama Ventures, a global chemical manufacturer, ran its Port Neches, Texas facility with a PM-to-CM ratio below 50%. Despite existing investment in SAP PM and IBM Maximo they relied on paper-based work orders, a reactive break-fix culture, with maintenance backlog stretching 24 weeks. After deploying Innovapptive's Connected Worker Platform, the site closed its work order categorization gaps, moved technicians off paper and onto mobile execution, and tracked PM ratio as a live metric instead of a month-end report. The results followed within 12 months:
| Metric | Before | After |
|---|---|---|
| PM-to-CM ratio | 45% | 80% |
| Maintenance backlog | 24 weeks | 10 weeks (58% reduction) |
| Work instruction adoption | Under 20% | 85% |
| Parts availability | 55% | 95% |
The shift contributed to $29M in realized EBITDA savings in 2025, with a $50M enterprise-wide cost takeout opportunity identified for global rollout.
See How Indorama Ventures Achieved A 58% Reduction In Maintenance Backlog.
Discover how a connected worker approach moves the needle on maintenance reliability, workforce productivity, and bottom-line profitability.
Read the full Indorama Ventures case studyPreventive vs Corrective Maintenance: Detailed Comparison
To apply the improvement steps above, you need to be clear on what each maintenance category actually means, and how each one should be classified in your CMMS or ERP PM module. Miscategorized work orders are one of the most common reasons a PM ratio looks better on paper than it performs in practice.
PM vs CM vs Breakdown
| Attribute | Planned (Preventive / PM) | Corrective (CM) | Breakdown |
|---|---|---|---|
| Definition | Scheduled in advance: PMs, predictive tasks, pre-arranged repairs | Equipment degraded but still running, caught early, then scheduled | Equipment stopped, emergency response needed immediately |
| When it occurs | Proactively, before any failure signal | After a degradation signal such as, rising temperature, vibration spike, etc. | After complete failure, no advance warning |
| Cost relative to planned work | 1× baseline | 3× to 5× more per labor hour | 5× to 10× more per labor hour |
| Effect on PM ratio | Increases PM% | Decreases PM% | Decreases PM% severely |
| Target share of total work | 80% or more | Less than 15% | Less than 5% |
| Work order type in CMMS / ERP PM | PM order / PdM order | Corrective notification / CM work order | Breakdown or emergency work order |
Most CMMS tools and ERP PM reports simplify this into two buckets: planned vs unplanned, where unplanned combines corrective and breakdown together. The three-bucket model just gives you more precision when you are trying to diagnose why the ratio is underperforming.
Benchmarks Show The Gap. A Blueprint Shows The Way.
To consistently hit world-class PM ratios, you need an actionable strategy to optimize your scheduling, digitize your workforce, and leverage AI to prevent failures before they happen.
Download the AI Maintenance BlueprintWhy Correct Work Order Categorization in CMMS Is the Foundation of PM Ratio Accuracy
Your PM ratio is only as reliable as your data. If corrective jobs are miscoded as PMs, or if planned work remains open in the field due to execution gaps, your metrics will mask your true performance.
Before setting a baseline, audit your last ninety days of work orders against the planned, corrective, and breakdown. Specifically, identify any corrective tasks closed as PM completions. Even a small percentage of miscategorization rate can shift your ratio by several percentage points.
Why Most Teams Get Stuck: Root Causes of a High CM Ratio
If you have worked through the improvement steps and your CM ratio is still high, one of these five causes is usually the reason.
1. No Standard Process for Work Requests
When operators or supervisors request maintenance work verbally, by text, or on a sticky note, it bypasses the CMMS entirely. The work gets done, but it never becomes a work order, never gets categorized, and never shows up in your ratio. Over time, this informal work inflates your actual reactive exposure well beyond what the system reports. Every request must pass through a formal intake process and be converted into a categorized work order before action is taken.
2. Low Work Order Capture Rate
Industry benchmark data shows reactive maintenance teams capture around less than half of their actual work in the CMMS, while disciplined programs capture closer to 80%. If more than 30% of your maintenance activity is off-system, the PM ratio you are tracking is not your real PM ratio. It is just the ratio of the work that got logged. Fix the capture rate before you try to move the ratio.
3. No Asset Criticality Framework
Without a ranking system, every breakdown receives emergency priority. When non-critical repairs compete with production-essential assets, your planned PMs are consistently sidelined. Criticality rankings ensure your team focuses on the assets that actually stop production.
4. Aging Equipment with No Condition Monitoring
Aging equipment often fails between standard inspection windows. According to the 2021 Plant Engineering Annual Maintenance Survey aging assets are the leading cause of unplanned downtime at industrial facilities. Unless you supplement fixed-interval PMs with condition-based techniques, such as vibration analysis or thermography, these assets will continue to trigger reactive work.
5. The Field Execution Gap
A PM that is scheduled correctly but fails to close in the field is not just an execution but planning failure as well. Without digital work instructions or mobile sign-off capabilities, technicians are often forced to abandon scheduled tasks for urgent reactive calls. This is a classic execution failure: the schedule works, but the field delivery does not.
Why a High CM Ratio Costs More Than You Think
According to research from the University of Tennessee's Reliability and Maintainability Center, emergency repairs cost 3 to 10 times more than the same work performed on a planned schedule.
This emergency premium comes from several areas:
- Direct Costs: Rush shipping for parts, overtime labor, and expedited contractor fees.
- Production Costs: Lost output during unplanned downtime and potential quality issues.
- Safety Risks: Increased danger inherent in performing rushed repairs.
Beyond these visible expenses, there is a compounding cost. Every emergency repair displaces a scheduled maintenance task, causing new equipment issues to go undetected and eventually trigger another failure. Reactive programs stay stuck in this loop not because of bad leadership, but because the constant pressure of emergencies prevents the team from performing the very work needed to break the cycle.
The Business Case for Planning
The math for shifting to a planned culture is straightforward. If a plant performs 1,000 maintenance hours monthly at 50% planned work, that equals 500 reactive hours.
By shifting that ratio to 80% planned, you replace 300 of those expensive reactive hours with efficient, scheduled work. At a conservative 4x cost premium for emergency repairs, the savings generated by this shift alone can translate into significant annual bottom-line impact.
Also, read: How to Reduce Maintenance Costs: Eight Proven Strategies
How a Connected Worker Platform Improves Your PM Ratio
Improving your PM/CM ratio requires a connected worker platform that bridges the gap between system planning and field execution. Here is how it drives performance: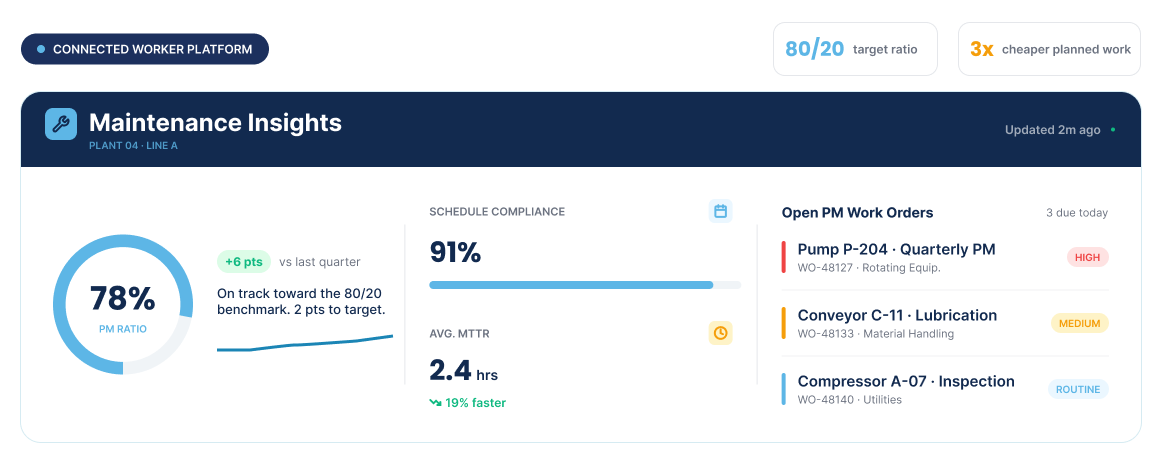
1. Mobile Maintenance: Getting PMs Done in the Field
A planned work order only improves your ratio when it is completed. When technicians lack digital procedures, face connectivity issues, or endure manual sign-off delays, planned jobs slip or remain open, dragging down your metrics.
Innovapptive's Mobile Maintenance eliminates this friction by putting the entire workflow on a ruggedized mobile device. With WorkSmartAI™, technicians access step-by-step instructions at the point of work, while RapidSync™ ensures seamless offline access for remote or basement locations. By syncing work orders directly to ERP or your CMMS in real-time, you eliminate end-of-shift data entry and ensure every completed PM is captured instantly.
Real-World Impact: After deploying Innovapptive's Connected Worker Platform, global chemical manufacturer Indorama Ventures transformed their maintenance culture, moving their PM/CM ratio from 45% to 80% in just 12 months.
2. Planning and Scheduling: Turning a Calendar Into Completed Work
There is a fundamental difference between a PM on a calendar and a PM that actually gets done. The gap is usually caused by execution friction, missing parts, unreadied permits, or misaligned technician skills.
Innovapptive's Planning and Scheduling module removes these bottlenecks. It matches technician assignments against real-time availability, alerts the storeroom to stage parts before the job begins, and builds permit lead times directly into the schedule. When these operational conditions are met, more planned work is completed within the shift. Customers using these tools regularly report schedule compliance rates above 90%, proving that when you remove execution barriers, the PM ratio naturally improves.
3. Maintenance Insights: Managing the Ratio in Real Time
A PM ratio that only appears in a month-end report is a lagging indicator. By the time you review it, weeks of potential improvement have already been lost.
Innovapptive's Maintenance Insights dashboard transforms the PM/CM ratio into a live operational metric. Because it is powered by real-time data from the field rather than periodic CMMS exports, it allows leaders to pivot instantly. Instead of asking, "Why was last month's ratio low?" you can ask, "Which assets are generating the most corrective work this week, and what do we adjust?" This transition from static reporting to real-time signals is exactly how top-tier programs sustain an 80%+ ratio over the long term.
Ready To Move your PM-to-CM ratio from 45% to 80%+?
From AI-powered scheduling to field-ready mobile maintenance, Innovapptive provides the tools to turn your CMMS data into reliable, scheduled execution.
Take a Self-Guided Product TourWorld-Class Maintenance Benchmark: What Top Performers Do Differently
World-class manufacturers consistently achieve PM ratios of 85%–90% or higher. While these benchmarks capture attention, the true differentiator is the operational behavior that sustains them.
- Tracking PM Ratio With Shift-Level Visibility: Top performers don't wait for monthly reports. They treat PM ratio as a live management tool, tracking completion rates down to the individual shift or teams. This immediate visibility allows supervisors to address bottlenecks in real-time rather than reacting to outdated compliance data.
- Leveraging A Formal Asset Criticality Framework: Every asset is categorized by a documented criticality tier. This hierarchy dictates PM frequency, technician skill requirements, and inspection depth. Tier 1 assets receive rigorous, high-frequency attention, while lower-tier equipment is shifted to condition-based monitoring to ensure resources are never wasted on low-impact work.
- Using Condition Monitoring as Standard: World-class teams view vibration analysis, oil tribology, and thermography as essentials, not extras. By detecting early degradation signals that fixed-interval PMs often miss, these teams generate corrective work orders before failure occurs, keeping breakdown maintenance minimal.
- Conducting Closed-Loop Root Cause Analysis (RCA): In top-tier programs, every unexpected failure triggers an RCA. The goal is to determine why the PM program missed the defect and update the process accordingly. Such analysis must be directly aligned to the specific work order, ensuring the improvement signal remains permanently attached to the maintenance record.
- AI-Driven Planning at Scale: Manual scheduling often collapses under the weight of large asset populations. World-class teams leverage AI to eliminate scheduling friction such as, the wrong technician, poor routing, or un-staged parts, that erodes ratios over time. Innovapptive's WorkSmartAI™ handles this optimization automatically.
- AI plan automates the conversion of ERP notifications into actionable work orders.
- AI detects surface equipment anomalies before they escalate into reactive jobs.
- AI assist guides technicians through troubleshooting in real-time, drastically reducing repair time.
By automating these complex processes, these tools separate facilities that merely reach a 70% PM ratio from those that reliably sustain 90%+.
Stop Managing Maintenance By Spreadsheet And Start Managing It By The Clock.
See how real-time mobile data entry eliminates data lag between the physical warehouse and your SAP records.
Schedule a Personalized Demo
Unlock Margins Hidden in your Maintenance
Watch how leading manufacturers improve OEE, increase PM compliance, and reduce downtime through connected execution.

- 06-07-2026
11 Best Maintenance Management Software Tools
Maintenance technicians often spend only 25 to 35 percent of their shift on hands-on work.The rest...

- 03-07-2026
10 Best Connected Worker Platforms for Industrial Use
Connected worker platforms have evolved beyond digital forms and mobile inspections. Today,...

- 29-06-2026
Planned Maintenance Percentage: Formula & Benchmarks
Every hour a maintenance team spends reacting to breakdowns is an expensive missed opportunity;...