
What Is Equipment Uptime and How Do You Calculate It?
Equipment uptime is the share of scheduled operating time that an asset is actually running and available to produce. It is the simplest measure of whether a machine is doing its job when the plan calls for it.
You calculate equipment uptime by dividing the hours an asset was actually running by the hours it was scheduled to run, then multiplying by 100 to get a percentage.
|
Equipment uptime formula Uptime (%) = (Actual running hours divided by scheduled operating hours) x 100 |
Here is how that looks with real numbers. A boiler feed pump is scheduled to run 168 hours in a week. Unplanned failures take it out of service for 9 hours. Its uptime for that week works out as shown below.
|
Input |
Value |
|---|---|
|
Scheduled operating hours |
168 hours |
|
Unplanned downtime |
9 hours |
|
Actual running hours |
159 hours |
|
Uptime calculation |
(159 / 168) x 100 |
|
Uptime result |
94.6% |
Two things can make the same performance look different from one site to the next, and both are worth naming:
- Planned maintenance treatment: If one plant counts a planned overhaul as downtime and another leaves it out, the two will report different uptime for identical machines.
- Idle time: An asset sitting idle because there is no production demand is not down in any way maintenance controls. If idle time is charged against uptime, the number punishes maintenance for a production decision.
Plants need to pick one rule for each and apply it to every site.
12 Ways to Improve Equipment Uptime and Reduce Breakdown
The twelve strategies below are ordered roughly the way a plant should work through them, starting with deciding which assets matter most and ending with learning from every failure. Each one targets a specific point where uptime is commonly lost. You do not have to do all twelve at once. Start where your biggest losses are and build from there.
1. Rank assets by the cost of an hour of downtime, not by an old criticality label
Start by ranking your assets by what one hour of downtime actually costs in lost production, rather than by a criticality rating set years ago at commissioning. A label tells you an asset matters. A cost figure tells you how important, in tons per day or barrels per day, and lets you compare two assets honestly.
- The practical test: can your team name the hourly cost of your ten most important assets stopping, without digging through old records to work it out? If not, the ranking is a label, not a number you can act on.
- Revisit the ranking when the production plan changes. Asset bottlenecks depend on the product mix and season, so last year's priority list may no longer be right.
- Metrics to watch: Critical-asset maintenance coverage, the share of maintenance hours spent on the production-critical assets that carry today's plan.
2. Shrink detection lag by feeding operator rounds and sensors into one queue
Close the gap between an operator noticing a change on a round and someone who can actually act on it. The common failure is quiet: a reading gets written on a paper round sheet, the sheet gets filed, and nobody spots the trend until the asset stops.
- Ensure that sensor data and human observation belong in the same queue. When they sit in two systems, you get two watchlists, two priorities, and an alert that nobody owns.
- Most collected condition data is never acted on. A simple rule keeps it honest: a reading that does not lead to a work order is not monitoring, it is just storage.
- Moving from paper to digital operator rounds helps here, because an out-of-range reading can raise a work request against the exact equipment on the spot, instead of a note that sits on a clipboard.
- Metrics to watch: Mean time to detect (MTTD), how quickly problems are caught, along with the share of failures that had an early warning sign nobody acted on.
3. Turn a reported problem into a live work order in minutes, not shifts
Measure the time between a problem being reported and a scheduled, resourced work order existing in your system of record. In many plants this generally occurs when shifts change, and that delay is exactly the gap between seeing a problem and acting on it.
- Part of the delay is the record itself. Raising a breakdown work order in SAP can take six separate transactions, which is why technicians often do not do it at the machine, and why the record arrives late or never gets created at all.
- A late record does more than hold up one job. It leaves gaps in the failure history that later reliability decisions depend on, so the plant ends up making calls on incomplete data.
- Tools such as WorkSmartAI let a technician raise a structured work order from a photo or a short voice prompt, with the equipment identified automatically, and RapidSync keeps that record in sync with SAP or IBM Maximo within minutes even while offline.
- Metrics to watch: Notification-to-work-order time, the average hours from a problem being reported to a work order being released to the crew.
4. Prove parts readiness before the job reaches the schedule
Make sure the exact parts for a job are picked, staged and confirmed before that job is scheduled, rather than finding out the part is missing when the crew is already at the machine. A part showing as in stock in the system is not the same as a part that is physically ready to install.
- This is an uptime problem, not just an inventory problem. When a job is pushed because the part was not ready, the asset stays down for a whole planning cycle, not just the few minutes it takes to walk to the storeroom.
- Treat parts readiness as a checkpoint the job has to pass. If the materials are not confirmed and staged, the job does not go on the schedule yet.
- Getting parts kitted and staged against the specific work order, supported by spare parts management software, is what makes that checkpoint real rather than a box someone ticks.
- Metrics to track: Parts availability at the job, how often the right parts are on hand when the crew arrives, along with the job reschedule rate for missing materials.
5. Clear permits and isolations ahead of the job
Treat the time crews spend waiting for a permit or an isolation as downtime you can measure and reduce, not as unavoidable safety paperwork. In asset-intensive industries such as oil, gas, chemical and mining plants, most maintenance work needs a permit before it can begin, so a slow permit process directly holds up the repair and keeps the asset down longer.
- The fix is to have the permit, the isolation plan and the protective equipment requirements ready and attached to the work order in advance, rather than chasing them on the morning the job is due to start.
- A digital permit to work software keeps permits and job hazard analyses moving instead of sitting on someone's desk, which is where a large share of permit delay comes from in high-hazard plants.
- Metrics to track: Permit and isolation wait time, the technician hours lost each week waiting for a permit or an isolation, tracked as its own category of downtime rather than buried inside repair time.
Also, read: What Is an Electronic Permit to Work (ePTW)?
6. Raise schedule compliance and stop churning the frozen schedule
Increase the share of scheduled work that actually gets completed in the week it was planned for. Schedule compliance is one of the most overlooked drivers of uptime, and in many plants only around 60 to 65 percent of planned work gets done on plan.
- The mechanism is direct. A schedule broken mid-week converts planned work into emergency work, and emergency repairs typically cost three to ten times a planned job.
- Hold a freeze window as a discipline, not a system setting. Once the weekly schedule is frozen, only a genuine emergency breaks it.
- Higher schedule compliance raises wrench time, higher wrench time closes work faster, and faster closure shortens the downtime window. That chain is what makes schedule compliance pay off.
- Metrics to track: Schedule compliance and PM ratio, the share of planned work completed on plan, and the PM ratio of planned to reactive work.
7. Decompose MTTR and fix the longest delay
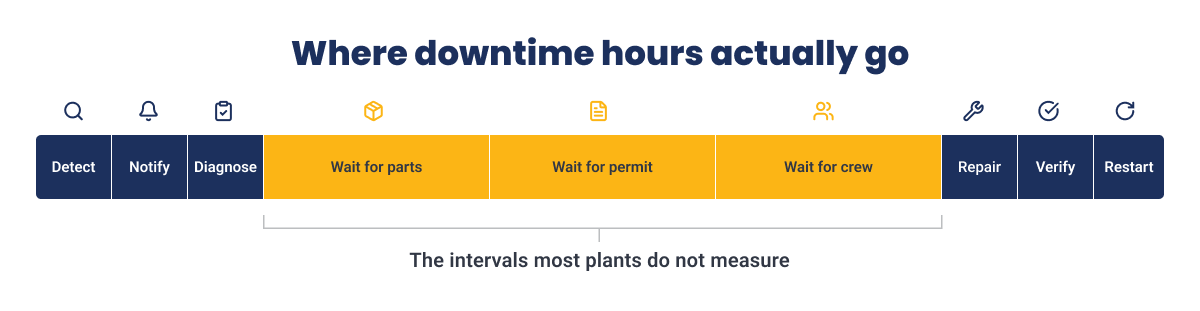
Break mean time to repair (MTTR) into its real intervals: detect, notify, diagnose, wait for parts, wait for permit or isolation, wait for a competent crew, repair, verify, restart. Relying only on mean time to repair hides all of these intervals and tells a maintenance leader very little.
- In most asset-heavy plants, the hands-on repair is a small part of the total time an asset is down. Most of it is waiting. A team focused only on working faster is fixing the smallest part of the problem.
- MTTR is usually easier to influence than the time between failures, so for many plants it is the better place to start.
- The stages a maintenance team can actually control are detection, reporting, and parts and permit readiness, which are the same things covered by the strategies above.
- Metrics to track: MTTR by interval, mean time to repair broken out by stage, rather than as a single number.
8. Put the work instruction at the asset, not in a binder
Give technicians the correct, up-to-date work instruction at the machine, instead of leaving it in a binder in the planner's office or existing only in the memory of a technician who is about to retire. When the right instructions are available at the point of work, jobs get done right the first time and rework drops.
- There is a difference between a document and a usable instruction. A usable instruction is step by step, current, and guaranteed to be the latest version at the point of work.
- Digital work instructions with version control mean a crew is never working from an out-of-date procedure, and the knowledge does not walk out the door when an experienced technician leaves.
- Metrics to watch: First-time fix rate, the share of jobs done correctly on the first visit, along with the rework rate.
9. Retire preventive maintenance tasks that never find a problem
Look at your preventive maintenance tasks and retire the ones that consistently turn up nothing. This is the one strategy on the list that removes work rather than adding it, and it gives back both technician hours and planned downtime the plant can use elsewhere.
- Across industry, a meaningful share of preventive maintenance work adds little value, and calendar-based tasks only catch some failures. The sensible response is to remove the tasks that are not earning their place, not just to keep adding more.
- A task worth reviewing is a preventive job that has generated no follow-up repairs over several cycles.
- This is about adjusting intervals based on evidence, not about deferring due work. The method is covered in more depth in our guide to preventive maintenance optimization.
- Metrics to track: PM hours per finding, preventive maintenance hours spent for each problem found, along with the planned downtime those tasks consume.
10. Ensure that the insights from a handover passes on to the next shift to prevent diagnosis from scratch
When a fault is partly diagnosed at the end of a shift, make sure that progress reaches the next crew. When it is handed over verbally or on a whiteboard, the incoming crew re-diagnoses from scratch and the elapsed downtime doubles for no extra work done.
- Four things need to carry across a handover for it to count: what the symptom is, what has been ruled out, what has been isolated, and what the next step is.
- A structured, digital shift handover software keeps that detail intact between crews, so the next shift picks up where the last one left off.
- Metrics to track: Cross-shift resolution time, how much longer faults take to resolve when they span a handover, compared with those handled within one shift.
11. Keep execution working even when offline
Make sure work can be executed and recorded where there is no signal. In intrinsically safe zones, tank farms, underground workings and dead-spot plant areas, offline capability is a necessary requirement, not a convenience.
- When execution is online only, the technician completes the job and records it hours later from a desk. That delays the record, leaves gaps in labor and failure data, and removes any chance to act on what was found while the asset is still open.
- Offline execution that stores the work on the device and syncs it once the signal returns, along with device-to-device sharing when the network is down, keeps the record accurate and on time.
- Metrics to track: Point-of-work capture rate, the share of work records created at the asset versus entered later from a desk.
12. Close the loop with failure coding and root cause analysis
Code every repair with problem, failure and action codes so a repair becomes reliability data rather than a closed ticket. When codes are skipped or inconsistent, the failure history cannot support any later interval or replacement decision.
- Set a trigger for deeper investigation. When the same asset fails the same way inside a set period, run a structured root cause analysis rather than another quick fix.
- This strategy comes last in the order but pays back the most over time, because it is what stops the same breakdown from happening again. Many repeat breakdowns trace back to a handful of common causes of equipment failure that good coding makes easy to see.
- Metrics to track: Repeat failure rate, how often the same asset fails in the same way within a set period.
Turn these 12 strategies into a working AI plan.
Get the practical blueprint for moving from reactive, disconnected maintenance to continuous, AI-supported execution across your plant.
Is Your Uptime Number Actually Good? Availability, OEE and Realistic Benchmarks
Once you can measure uptime, the next question is whether your number is any good. A single percentage does not tell you much on its own, because a lot depends on what you chose to count and on the type of asset you are measuring. This section helps you understand your uptime number properly and set a target that fits your plant.
Uptime, availability and OEE: what each number hides
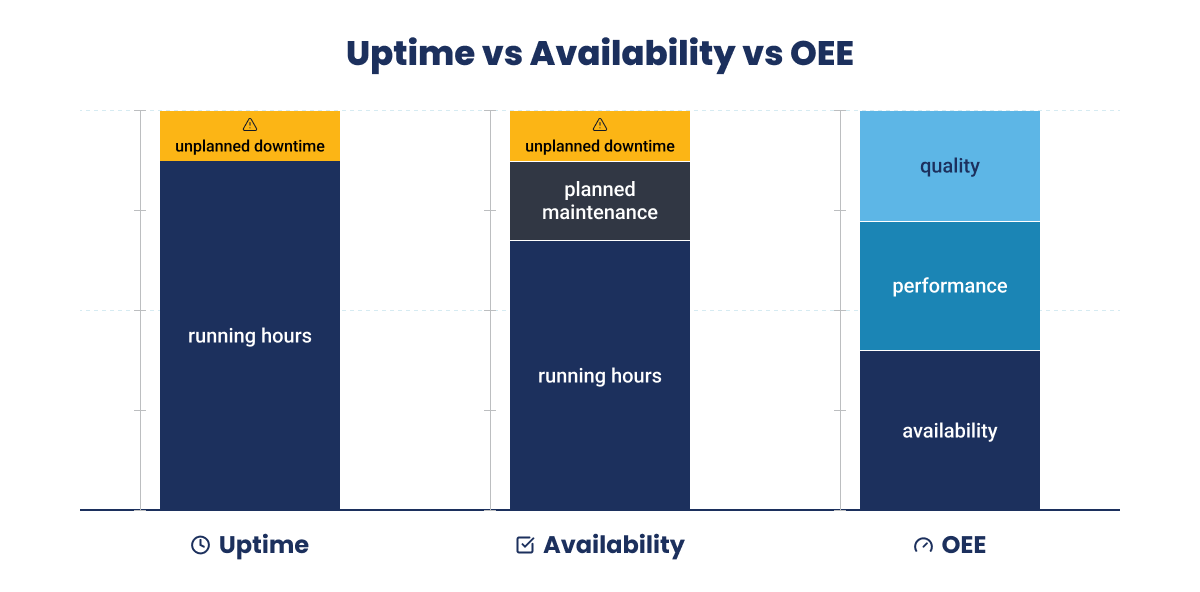
Uptime, availability and overall equipment effectiveness sound similar but measure different things, and mixing them up is how a slow-running asset can still look healthy on an uptime report. Here is how they compare.
|
Metric |
What it measures |
How it is calculated |
What it leaves out |
|---|---|---|---|
|
Equipment uptime |
How much of the scheduled time the asset was running |
Running hours / Scheduled operating hours x 100 |
Speed and quality. A machine running slowly can still show high uptime. |
|
Availability |
How much of the time the asset was able to run |
Running hours / (Running hours + all downtime) x 100 |
Whether the asset was actually needed. Idle time can make it look better than it is. |
|
OEE |
How much good output the asset produced against its full potential |
Availability x Performance x Quality |
Nothing on its own, but it needs speed and quality data, not just running hours. |
The practical point is that a plant can push uptime up while OEE falls, because uptime says nothing about how fast the asset ran or whether the output was good. If uptime is the only number you report, a machine that runs below its rated speed never shows up as a problem. Maintenance and reliability leaders should watch all three, not just the one that is easiest to report.
Realistic uptime benchmarks by asset type
There is no single good uptime number that fits every asset. A sensible target depends on the type of equipment, whether it has backup, and whether it sits on the critical path for production. The ranges below are directional, drawn from reliability practice and the approach set out in ISO 14224, and are meant as a starting point rather than fixed targets.
|
Asset type or setup |
Typical availability range |
What usually limits it |
Where the gains usually come from |
|---|---|---|---|
|
Rotating equipment running continuously (pumps, compressors, fans, gearboxes) |
High 90s in a strong program |
Seal, bearing and lubrication failures, and long lead times on parts |
Condition monitoring plus confirmed parts readiness |
|
Fixed process equipment (heat exchangers, vessels, columns) |
Very high when inspected on time |
Fouling and corrosion found too late |
Operator rounds plus discipline on inspection intervals |
|
A single production line with no backup equipment |
Lower, with little room for error |
One failure stops production outright |
Priority-based preventive maintenance and staged spares |
|
A line with backup or parallel equipment |
Higher, with more room to recover |
A backup unit that has quietly failed |
Testing the backup unit, not just the one in service |
|
Mobile or mining fleet |
Mid-to-high 80s is common |
Hard operating conditions, travel to the repair, and remote parts |
On-board condition data plus faster field execution |
Be careful with the 99.9 percent uptime figures you see quoted online. Those come from IT and website-monitoring sources and describe systems with instant automatic backup, which a single compressor does not have. Set your target from your own asset and its backup, using ISO 14224 as a guide.
The KPIs That Prove Uptime Actually Improved
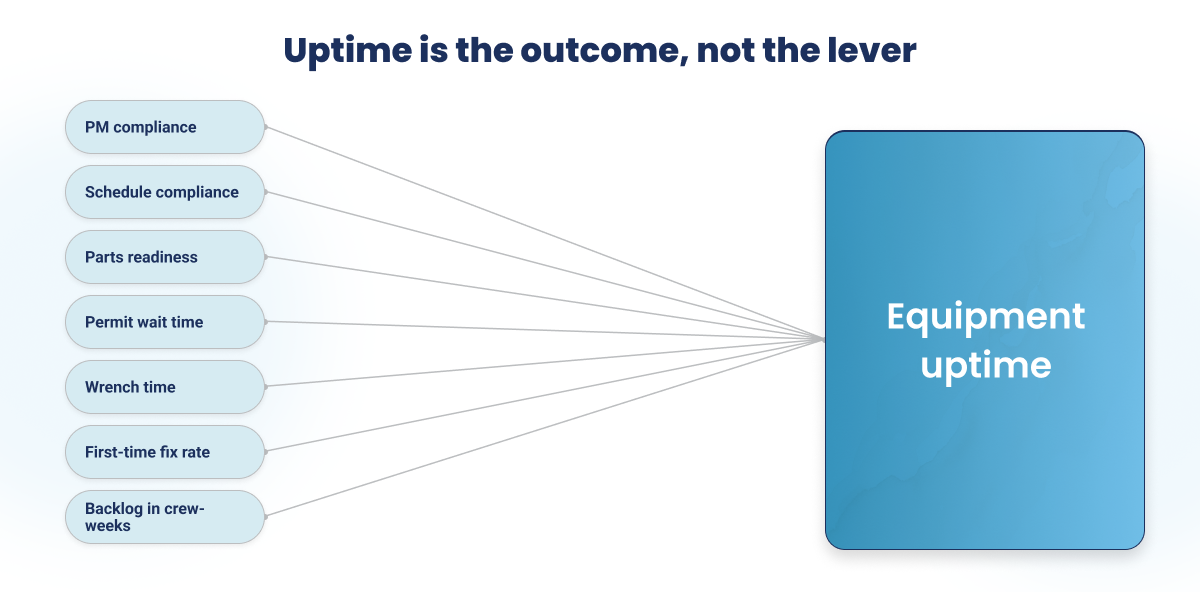
Uptime is a result, not something you control directly. A plant that reports only uptime cannot explain why the number went up or down. The eight KPIs below are the measures that actually drive uptime, each with how it is calculated and the direction you want it to move.
|
KPI |
How it is calculated |
What it tells you that uptime does not |
Target direction |
|---|---|---|---|
|
MTBF (mean time between failures) |
Total operating time / Number of failures |
How often the asset fails, not just how long it ran |
Higher |
|
MTTR (mean time to repair) |
Total repair time / Number of repairs |
How fast you recover, and where the time goes when broken out by stage |
Lower |
|
PM compliance |
PM tasks completed on time / PM tasks due x 100 |
Whether planned work is actually happening on plan |
Toward 90% and steady |
|
Schedule compliance |
Scheduled tasks completed in the week / Tasks scheduled x 100 |
How much of the weekly plan survives the week |
Toward 85%, from a common 60-65% |
|
Planned vs reactive ratio |
Planned maintenance hours / Total maintenance hours x 100 |
How reactive the plant still is |
Rising toward 80% planned |
|
Wrench time |
Hands-on tool time / Total shift time x 100 |
How much of the shift is lost to waiting and travel |
Toward 50%+, from a common 25-35% |
|
First-time fix rate |
Jobs fixed on the first visit / Total jobs x 100 |
Whether the fix held, not just that it happened |
Higher |
|
Maintenance backlog |
Total ready work hours / Weekly crew capacity hours |
Whether maintenance is keeping up with demand |
A healthy band is often 4-6 crew-weeks |
If your plant tracks none of these today, start with three: schedule compliance, MTTR broken out by stage, and maintenance backlog in crew-weeks. Those three explain most of what moves uptime.
Uptime and Plant Bottlenecks: Where Higher Uptime Pays Back, and Where It Does Not
Improving uptime only pays off when the effort lands on the right asset and the number is real. Put time and money into raising uptime on a machine that is not limiting production, and you get no extra output for it. The asset that sets the pace for the whole plant is the bottleneck, and that is where uptime work returns the most.
1. Find the bottleneck before you invest in uptime
Find the bottleneck first: which asset's stoppage actually shows up in the plant's daily output number, and which asset's stoppage is absorbed by buffer, backup equipment or downstream slack. Spend uptime effort on the first kind.
- The answer changes over time, because the bottleneck moves with product mix, the production plan and the season.
- A common mistake is to rank assets by how often they break down, which points effort at the machines that fail most, rather than by how much output is lost, which points effort at the machines that matter most.
- Metrics to track: Production lost per asset, the output units lost per asset over a period, rather than downtime hours per asset.
2. When the bottleneck is the maintenance process, not the asset
Sometimes every asset is available and output still falls short. When that happens, the thing holding the plant back is usually not a machine at all. It is technician capacity, parts supply, permit throughput or approval queues, and the strategies above should then be applied in a different order.
- The signal is clear. When your assets are available but the backlog keeps growing in crew-weeks, the bottleneck is maintenance capacity, not asset reliability.
- Manual handoffs between systems slow the whole maintenance process down, which ties straight back to the strategies on notifications, parts readiness and permits.
- Metrics to track: Backlog in crew-weeks, the ready work backlog measured in crew-weeks, along with standard hours completed per crew each week.
3. Three ways an uptime number can look better than it is
The fastest way to raise reported uptime is to defer planned maintenance, and it works for a quarter or two before the deferred work returns as unplanned downtime. A higher number is not always a better outcome.
- Deferring planned maintenance borrows uptime from next quarter and pays it back as a bigger turnaround.
- Running an asset there is no production demand for produces uptime and no output.
- Running a machine below its rated speed to avoid stopping trades output for availability, and shows up in OEE rather than uptime.
4. What maintenance controls, and what it does not
It helps everyone to be clear about the boundary here. Maintenance owns detection, response time, readiness and the quality of the repair. Maintenance does not own the production plan, how often lines change over, feedstock quality, how the plant is operated, or capital decisions on replacing equipment.
When a maintenance team is held to an uptime target it only partly controls, it will tend to manage the number rather than the asset, which is how the traps above take hold. The bigger picture matters too: a large share of installed industrial capacity sits idle at any given time, which is a reminder that uptime is a plant-wide question, not one the maintenance team can answer alone.
Close the insight-to-execution gap on your plant floor.
Most lost uptime hides in the insight-to-execution gap, the hours between a problem being seen in the plant and tracked, resourced work existing in your system of record. See how a frontline execution platform closes that gap and turns waiting time into recovered uptime.
How Improving Equipment Uptime Reduces Maintenance Cost
Higher uptime lowers maintenance cost because it shifts work out of the expensive, reactive column and into the cost effective, planned one. Reactive maintenance, also called breakdown maintenance, is work carried out after a failure, and it runs on overtime, rush parts, expedited freight and contractor cover. Emergency repairs of this kind typically cost roughly three to ten times a comparable planned job. The same repair costs far less when it is scheduled than when it is an emergency, so the plants that raise uptime usually cut cost at the same time.
The scale of this is well documented. Across industries, the Information Technology Intelligence Consulting (ITIC) 2024 survey put the cost of a single hour of downtime above USD 300,000 for more than 90 percent of mid-size and large enterprises, with 41 percent reporting that an hour costs between USD 1 million and more than USD 5 million. Studies of maintenance programs, including the U.S. Department of Energy's Operations and Maintenance Best Practices Guide, consistently find that reactive maintenance costs far more than planned maintenance, which is why the cost of unplanned downtime sits at the heart of the maintenance cost problem.
The table below shows how each gain in uptime feeds through to lower cost.
|
What higher uptime changes |
Why maintenance cost drops |
|---|---|
|
Fewer breakdowns, more planned work |
Planned jobs avoid overtime and rush charges |
|
Fewer emergency call-outs |
Less reliance on contractors and premium labour |
|
Fewer rush part orders |
Lower expedited freight and less emergency stock |
|
Damage caught earlier |
A fault fixed early costs less than a full failure |
|
Steadier production |
Fewer missed shipments and penalty costs |
The result is a lower total maintenance cost, often measured as maintenance spend against the replacement value of the assets.
Indorama Ventures: An Uptime-Led Program That Cut Maintenance Cost
Indorama Ventures shows what this looks like in practice. The global chemical manufacturer ran its Port Neches, Texas site with a reactive maintenance culture: a planned-to-reactive ratio below 50 percent, a 24-week maintenance backlog, and heavy use of contractors and overtime, even with SAP PM and IBM Maximo already in place. By moving technicians onto mobile execution, improving parts readiness, and prioritising the work that protected the most output, the site raised uptime and completed more planned work without adding people. The cost results followed within twelve months.
|
Metric |
Before |
After |
|---|---|---|
|
Planned-to-reactive ratio |
45% |
80% |
|
Maintenance backlog |
24 weeks |
10 weeks |
|
Contractor headcount |
140 |
87 (38% lower) |
|
Overtime |
24% |
12% (halved) |
|
Parts availability at the job |
55% |
95% |
Together these changes contributed to USD 50 million in maintenance savings. The savings did not come from doing more maintenance. They came from completing the right work more efficiently: fewer breakdowns to chase, fewer contractor hours, less overtime, and less rework.
See how Indorama Ventures unlocked 50 million dollars in maintenance savings.
Read the full case study on how a connected worker approach cut the backlog from 24 weeks to 10, halved overtime, and moved the plant from reactive repairs to planned maintenance.
How Innovapptive Helps Asset-Heavy Plants Improve Equipment Uptime
Look back over the twelve strategies and a pattern stands out. Most of them are not really machine problems. They are handoff problems: a reading that never reaches a planner, a permit that waits for sign-off, a part that was not staged, a diagnosis lost at shift change. Each one is a break between a person in the plant and the system that runs it, and that break is where uptime leaks away.
Innovapptive is an industrial execution platform and connected worker platform built to close those gaps. Its mobile maintenance software, iMaintenance, gives technicians prioritised work on a mobile device with the work instructions, permits, forms and parts attached, and sends every action back to the system of record without duplicate data entry. It works alongside your SAP, IBM Maximo or Oracle system rather than replacing it, so your ERP stays the source of truth and there is no rip-and-replace project.
Two capabilities do most of the heavy lifting. WorkSmartAI lets a technician raise a structured work order from a photo or a prompt in seconds, with the equipment identified for them, so the six SAP transactions behind a breakdown work order collapse into a single screen. RapidSync keeps the field and the system of record in step with two-way sync in under five minutes, even in low-signal areas, so records arrive on time and the data stays clean. Together they close the gap between seeing a problem and acting on it, which is where most uptime is won or lost.
See the loop close on your own system of record.
Get a working walkthrough of a problem in the plant becoming tracked, resourced work in SAP or IBM Maximo in minutes, mapped to your assets, your permit types and your existing setup.

Unlock Margins Hidden in your Maintenance
Watch how leading manufacturers improve OEE, increase PM compliance, and reduce downtime through connected execution.

- 12-10-2026
Manufacturing Skills Gap: What It Costs and How to Close It
A plant can have every role filled and still experience a manufacturing skills gap. Very often,...

- 05-10-2026
10 Best Shift Handover Software Platforms for Plant and Process Operations
Shift handover software can mean different things depending on the operating environment. Some...

- 29-09-2026
Best SAP Maintenance Planning & Scheduling Software 2026
Your maintenance work orders live in SAP Plant Maintenance (PM), while the working schedule lives...