
What Is Asset Reliability?
Asset reliability is the probability that an asset performs its required function without failure, over a defined period, under stated operating conditions. It is expressed as a probability, either between 0 and 1 or as a percentage from 0 to 100.
This definition has three parts, and each one is what makes a reliability number usable in practice:
- Required function: An asset is reliable when it does its specific job, not simply when it runs. A cooling water pump is reliable when it delivers the rated flow at the rated head. It can keep turning and still fail its function.
- Defined period: A reliability figure holds significance only with a timestamp attached. Ninety percent reliable has to be ninety percent reliable over a stated period, whether that is 500 operating hours or the run to the next turnaround.
- Operating conditions: The same pump often has different reliability in two different services. Move it from clean water to a slurry duty and its reliability drops, even though the pump itself has not changed. A reliability number is only comparable when the conditions behind it are stated.
In everyday use, equipment reliability and asset reliability describe the same thing. Equipment usually refers to a single machine, while asset can cover anything on the register, including systems and functional locations, but the calculation is the same either way.
Asset Reliability vs Asset Availability
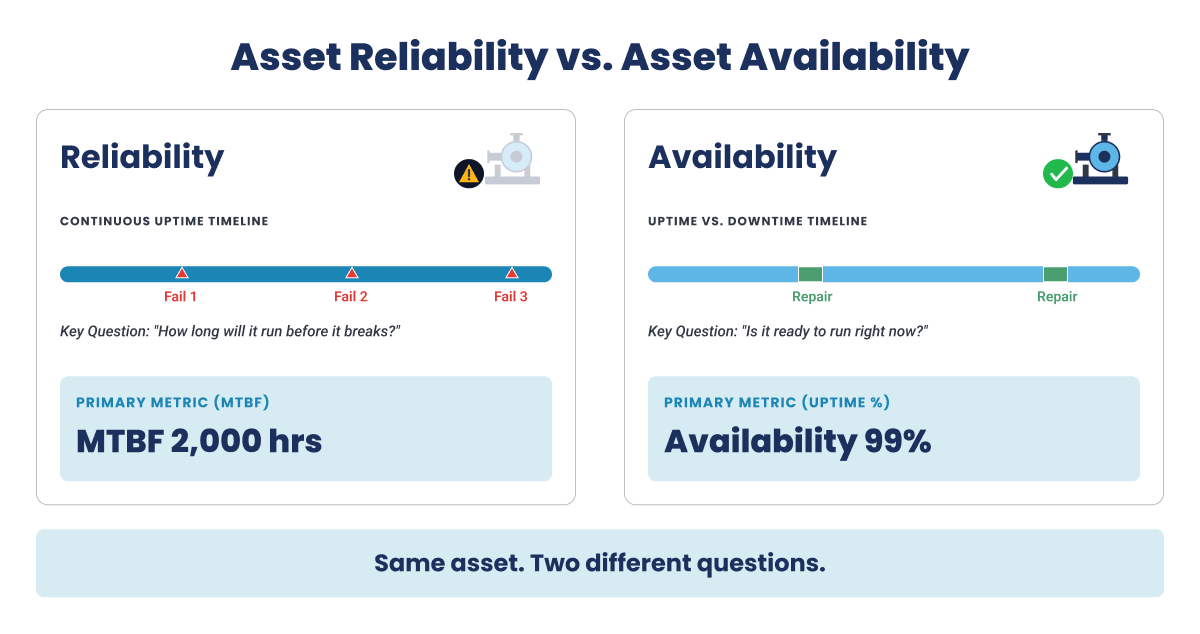
Reliability measures how often an asset fails. Availability measures how much of the time it is fit to run. While they might sound similar and are often confused as being the same, both terms are distinct and answer different questions.
An asset can show high availability and low reliability at the same time. A pump that fails often but is repaired quickly stays available for most of the shift, because each repair is short. So while the availability number looks healthy, the failure count shows that the asset is still unreliable.
| Asset Reliability | Asset Availability | |
|---|---|---|
| Definition | Probability an asset runs without failure over a stated period | Share of total time an asset is fit to perform its function |
| What it measures | How often the asset fails | How much of the time it is usable |
| Built from | Mean time between failures and failure history | Mean time between failures and mean time to repair together |
| Improved by | Removing the causes of failure | Removing failure causes and cutting repair time |
The practical rule for a reliability manager is straightforward. Manage critical assets that have no standby against reliability, because a quick repair does not help when the failure itself stops production or creates a safety risk. Manage against availability where a standby or a buffer absorbs short stoppages, which is where improving equipment uptime pays off.
How to Calculate Asset Reliability
Reliability is calculated from failure history, not from a sensor reading or a gut feel. Mean time between failures is the main input, and the reliability function turns that average into the probability that an asset survives a given run. The three steps below turn your work order data into a reliability figure you can defend.
Mean Time Between Failures (MTBF)
MTBF (mean time between failures) measures how long a repairable asset runs, on average, from one failure to the next. To work it out, take the total time the asset was actually operating and divide it by the number of failures recorded in that window.
| MTBF = total operating time / number of failures |
The usual error is counting calendar time instead of operating time. An asset builds no reliability while it sits idle, so including those idle hours inflates the figure and flatters the result. Base the number only on the hours the asset was genuinely running.
Worked example: a centrifugal pump runs 6,000 hours in a year and fails 3 times. Its MTBF is 6,000 divided by 3, which is 2,000 operating hours. This figure is useful as a trend for that pump, or to compare identical pumps in identical service. Comparing a slurry pump against a clean water pump is not a fair comparison.
Failure Rate
Failure rate, shown by the Greek letter lambda, is how many failures to expect per hour of operation. When the failure rate is steady, it is simply one divided by MTBF.
| Failure rate (lambda) = 1 / MTBF |
For the pump above, that is 1 divided by 2,000, or 0.0005 failures per operating hour.
Failure rate answers questions MTBF cannot. It tells the storeroom how many failures to plan spares for, and it lets you combine many components to estimate the reliability of a full system. It holds only while the failure rate stays steady, which is the long middle stretch of an asset's life. The next step relies on that.
The Reliability Function: Turning MTBF Into a Percentage
MTBF tells you how often an asset fails on average. It does not tell you the chance that a particular asset survives a particular run, which is what a planner needs. The reliability function makes that conversion. In other words, it takes the ratio of the run you are planning to the asset's MTBF and turns it into a survival probability.
| R(t) = e to the power of negative t divided by MTBF |
Here t is the mission time, the length of run you want the asset to complete, and e is Euler's number, about 2.718. The result is the probability, from 0 to 1, that the asset runs for time t without failing.
Take the same pump with an MTBF of 2,000 hours and ask two questions.
- To the next planned outage, 500 hours away: divide 500 by 2,000 to get 0.25, so R(500) = e to the power of negative 0.25, which is about 0.78. The pump has roughly a 78 percent chance of reaching the outage without failing.
- To the next turnaround, 2,000 hours away: divide 2,000 by 2,000 to get 1, so R(2000) = e to the power of negative 1, which is about 0.37. The pump has about a 37 percent chance of lasting that long.
The pump and its MTBF have not changed, only the length of run being asked about. This is why reliability is always tied to a specific period. A 37 percent chance of reaching the turnaround tells a planner to prepare a spare or plan an intervention now.
The formula above assumes a steady failure rate, which applies while an asset is in the stable middle of its life. This is known as the exponential reliability model. Once an asset starts to wear out, or fails early because of a defect, the failure rate is no longer steady, and a method called Weibull analysis fits better.
The Metrics to Track Alongside Reliability
A reliability figure on its own does not tell a maintenance manager whether the program is working. Reliability moves slowly, so it needs the metrics below alongside it to be read week to week. The planned maintenance percentage and the ratio of preventive to corrective work are useful leading indicators of program health.
| Metric | What it answers | Where the number comes from |
|---|---|---|
| MTBF | How often a repairable asset fails | Operating hours divided by failure count, from work order history |
| Mean time to repair (MTTR) | How long it takes to restore a failed asset | Repair labour time recorded against work orders |
| Failure rate | How many failures to expect per operating hour | The reciprocal of MTBF |
| Availability | How much of the time the asset is fit to run | Uptime measured against total time |
| First-time fix rate | Whether repairs hold or the same fault returns | Share of jobs closed without a repeat visit, from work order history |
For standard definitions and best-in-class target values for each of these, the SMRP Best Practices, Metrics and Guidelines from the Society for Maintenance and Reliability Professionals is the reference to use, rather than a benchmark built for a single plant.
AI Cannot Fix A Maintenance Program Built On Bad Failure Data.
See the practical blueprint for getting your data and execution foundations right first, then putting AI to work where it actually improves reliability.
Why Most Asset Reliability Numbers Are Wrong
Calculating asset reliability is simple, however accessing the correct data to calculate it is not simple. In most plants, the failure records behind MTBF are incomplete or miscoded in a handful of recurring ways, and an accurate formula on top of a flawed record still produces a wrong answer.
Below are five common ways a failure record gets distorted before it reaches the calculation:
- A breakdown logged as a preventive maintenance call: When a technician fixes a failure but the only order open on the asset is a preventive maintenance order, the breakdown often gets closed against that order because it is the quickest option. The failure never enters the failure count, which inflates MTBF.
- A work order closed with no failure code: At the end of a shift, or when working in a restricted area, the failure code is often the field that gets skipped. The repair is recorded but the cause is not, so the record cannot support any analysis of why the asset failed. It does not shift MTBF directly, but it makes the number impossible to trust.
- Several trips recorded as one event: An asset that trips three times in a week can appear as a single notification if the technician keeps updating the same one. Three failures collapse into one, which inflates MTBF.
- Repeat failures split across two equipment numbers: When a failed unit is replaced with an identical one and set up under a new equipment number, the failure history for that location is split in two. Neither record shows the real repeat-failure pattern, which inflates MTBF on both.
- Downtime measured from the wrong point: When downtime is counted from when the work order was raised rather than from when the asset actually stopped, MTTR and availability are both understated, which deflates the true downtime picture.
These errors do not all pull in the same direction. Some inflate MTBF and some deflate it, and the same asset can be wrong both ways at once. A reliability figure is only as good as the record behind it, so the record is worth checking before the number is trusted.
The standard built to fix this is ISO 14224. It defines the minimum data set, the equipment taxonomy, and the standard failure modes for reliability and maintenance data in oil, gas, and petrochemical facilities. A usable failure record needs three things: the right failure event tied to the right functional location, a failure code that records both cause and consequence, and accurate times for when the asset stopped and when it was back in service. Without them, the reliability number is only an estimate.
Where Asset Reliability Is Actually Lost
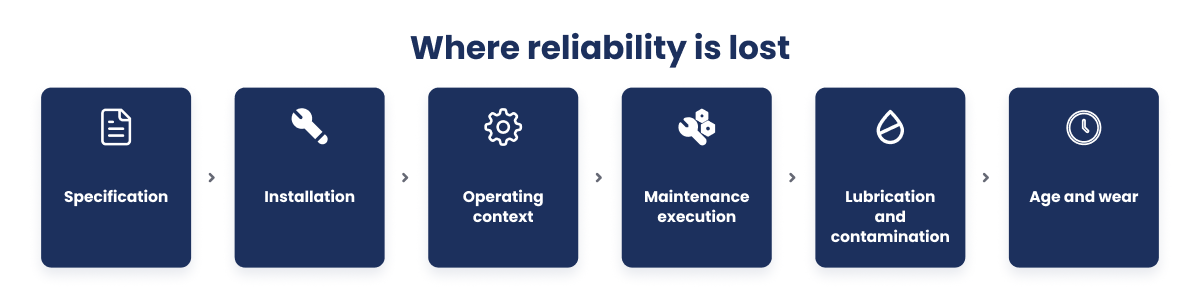
Reliability is not lost at a single point. It is lost gradually at six stages across an asset's life, and many plants put their effort into the stage that is hardest to change while overlooking the ones they can act on now. Taking the six stages in life order makes them easier to work through.
- Specification and design margin
Part of an asset's reliability is set before it arrives. An undersized pump, a motor with no margin for the real duty, or a material that does not suit the process creates a limit that maintenance cannot lift. There is little to be done about this stage once the asset is installed. - Installation and commissioning
How an asset is installed affects how it fails for the rest of its life. Soft foot, poor alignment, or pipework strain added during installation turn into recurring failures that later look random. - Operating context
How an asset is run matters as much as how it is maintained. Frequent starts, running away from the design point, and process upsets all reduce reliability, and much of this sits with operations rather than maintenance. - Maintenance execution quality
This is the stage where most plants can improve in the near term without new capital, and it is where reliability is most often lost without anyone noticing. A preventive maintenance task is only as good as the way it is carried out. The wrong lubricant grade shortens bearing life. Reassembly without an alignment check leaves the machine running rough from the start. Dirt introduced during the maintenance job itself sets up the next failure. The hardest one to catch is a preventive maintenance task marked complete in the system without being fully done, which produces a clean compliance report on a machine that was never actually serviced. None of these look like a maintenance problem at the time. They appear weeks later as an asset failure. Getting this stage right depends on giving technicians enough wrench time to do the job properly rather than rushing between callouts. - Lubrication and contamination control
A large share of bearing and gear failures come back to lubrication: the wrong lubricant, the wrong amount, or contamination. It is inexpensive to get right and costly to ignore, and like execution quality it is well within a plant's control. - Age and wear
Every asset follows the bathtub curve: a higher risk of failure early in life, a long steady middle, and a rising failure rate as it wears out. Knowing where an asset sits on that curve changes the decision, because a worn-out asset needs a different plan, and sometimes replacement, rather than another identical repair.
How to Improve Asset Reliability
Improving asset reliability is less about buying new tools and more about closing the gap between what the data says and what actually happens in the field, the insight-to-execution gap. The steps below only pay back in a set order. A plant that buys condition monitoring before its failure records and execution quality are in order ends up with more data and no change, because data was never the missing piece. Work through them in sequence, and treat the first three as the groundwork for everything after them.
- Fix the failure record first: Every later step depends on failure data you can trust, because a wrong record leads to wrong decisions. Get the failure events, codes, and times right before acting on any reliability number.
- Rank assets by criticality: Raising reliability everywhere is neither affordable nor necessary. Rank assets by what their failure costs in production, safety, and environmental terms, and direct effort to the ones that matter most.
- Improve the quality of the maintenance you already do: Before adding new work, make the current work count. That means precise execution, confirming a task was actually completed rather than just closed in the system, and steady lubrication practice. This is usually the quickest reliability gain, and it needs no new technology.
- Match preventive maintenance to the failure mode, not the calendar: A preventive maintenance task on a fixed interval that has no link to how the asset actually fails wastes effort and misses real failures. Reliability centered maintenance (RCM) is the structured method for choosing tasks based on how each asset fails.
- Move the right assets to condition-based maintenance: For a smaller set of critical assets, condition monitoring and condition-based maintenance are worth the investment, because these assets justify the cost of sensors and the platforms that read them. Applying the same approach across the whole asset register rarely pays off.
- Run root cause analysis on repeat failures: When an asset keeps failing, root cause analysis (RCA) finds the underlying reason. The value comes from changing the maintenance strategy in response, not just replacing the part, since a repair that only treats the symptom invites the next failure.
- Eliminate the defect at source: For failures that keep coming back despite good maintenance, the fix is a change to design, installation, or operation that removes the cause. This is defect elimination, and it is the only permanent solution for a recurring failure.
Apart from these some points maintenance leaders should note are as follows:
Being realistic about cost: Improving reliability on an older asset gets expensive quickly, and there is a point where each further gain costs more than it returns. For some assets, replacement is the more cost effective reliability decision.
Program ownership: These steps turn into a lasting program once ownership and a regular rhythm are added. That means one person accountable for the reliability figure, a fixed review cadence, and a tracked list of strategy changes from root cause analysis that are followed through to completion. Reliability that no one owns is reliability no one invests in.
Setting a Reliability Target You Can Defend
There is no single good MTBF that applies everywhere. A target that is not tied to the cost of failure is hard to justify and harder to fund, so set it from criticality instead, weighing the cost of the failure, its safety and environmental impact, and whether a standby exists. A demanding target is worth paying for on an asset whose failure stops the plant, and wasteful on one that has a standby beside it.
Where a standby already exists, it is often the most cost effective way to raise reliability, because two moderately reliable assets in a duty and standby setup deliver more dependable output than one highly reliable asset on its own. Finally, set targets by asset class in similar service rather than one figure for the whole site, which would average away the detail that makes a target useful.
The Best Reliability Strategy Still Fails If The Field Cannot Execute It.
See how the frontline execution platform is changing industrial maintenance, and why the plants closing the gap between insight and action are pulling ahead.
How Higher Asset Reliability Reduces Maintenance Cost
Higher reliability does not cut costs on its own. It cuts costs by changing the type of work a plant does, moving hours away from expensive, unplanned failure responses and towards cheaper, planned work. That shift shows up in four cost areas a VP of Maintenance and Reliability watches closely.
- Labour and overtime cost: Reactive work drives shift overruns and callouts. Estimates from the University of Tennessee's Reliability and Maintainability Center put the cost of an emergency repair at three to ten times the same job done on a schedule. Fewer failures means fewer of those premium hours, which is usually the first cost to fall.
- Outside contractor spend: When a plant runs short of internal capacity, unplanned work often goes to contractors at premium rates. A lower and more predictable failure rate gives a plant room to bring more of that work back in-house or schedule it at normal cost.
- Spare parts and inventory: Safety stock exists to cover unpredictable failures. When the failure rate is understood and repeat failures are under control, a plant can hold less emergency inventory without taking on more risk, which frees up working capital.
- Lost production revenue: This is the largest and least visible cost, because it never appears in the maintenance budget. Every hour a critical asset is down is output that cannot be recovered, and it is usually far larger than the repair cost that does show up on the maintenance line.
Two execution measures move these costs more than anything else: first-time fix rate and planning accuracy. A repair that holds the first time does not come back to use up the same hours twice. Accurate planning means the parts, permits, and people are ready, so scheduled work gets done instead of slipping into the reactive pile. Both sit at the centre of any effort to reduce maintenance costs.
One point on timing is worth setting expectations around. Reliability gains reach the cost line slowly. Backlog and contractor commitments take quarters to unwind, so the maintenance backlog and contractor spend fall well after the failure rate starts to improve. Measured against next month's cost report, a reliability program can look like it is not working. Measured across a year, it is where the savings come from.
Real-World Proof: Indorama Ventures Cut Maintenance Backlog by 58%
Indorama Ventures, a global chemical manufacturer, ran its Port Neches, Texas site on paper-based work orders and a reactive break-fix culture, with a maintenance backlog stretching to 24 weeks. After deploying Innovapptive's Connected Worker Platform to move technicians off paper and capture work as it happened, the site rebalanced its maintenance mix and shortened its backlog within twelve months.
| Metric | Before | After |
|---|---|---|
| Preventive to corrective ratio | 45% | 80% |
| Maintenance backlog | 24 weeks | 10 weeks (58% reduction) |
| Contractor headcount | Baseline | 38% reduction |
The change contributed to $19 million in realized annual savings, with a $50 million enterprise-wide opportunity identified for wider rollout.
From a 24-Week Backlog To A Reliability Program That Holds.
Discover how a connected worker approach helped Indoramma move the needle on maintenance reliability, workforce productivity, and bottom-line cost.
How Innovapptive Helps Industrial Plants Improve Asset Reliability
Most of the reliability problems in this guide come back to one thing: the gap between deciding what maintenance should happen and making sure it actually happens and gets recorded. Innovapptive is built to close that gap. It is the execution layer that sits on top of SAP Plant Maintenance, IBM Maximo, or Oracle EAM and makes sure the reliability work a plant has planned is carried out and captured properly. It does not predict failures or monitor asset condition, it works alongside those systems rather than replacing them.
Poor failure records usually start at the point of work. With Innovapptive Mobile Maintenance Software, technicians capture failure detail, completion evidence, and labour on the device as the job happens, and it flows straight back to the system of record through RapidSync™. That removes the shift-end reconstruction where failure codes get dropped, so the reliability history is built from what really occurred.
Execution quality improves when the right procedure travels with the job. Digital work instructions tied to the equipment and functional location put the correct steps, torque values, and lubricant grades in front of the technician. WorkSmartAI™ lets them raise an issue or work order from a photo or a prompt, so the record stays complete without extra data entry.
A planned reliability task only runs on schedule when parts and permits are ready, Innovapptive Electronic Permit to Work Software ensures that those are staged and made visible before work starts rather than discovered missing at the asset.
The platform is built to fit an existing landscape. It works out of the box with SAP ECC Plant Maintenance, supports IBM Maximo, and connects to historians, industrial IoT sensors, and reliability platforms such as Augury and Seeq, turning the decisions those tools produce into work that gets executed and recorded. That approach earned Innovapptive recognition as Frost and Sullivan's 2026 Company of the Year for Global Augmented Connected Worker Platforms.
Turn Reliability Insight Into Coordinated Frontline Action.
See how Innovapptive helps asset-heavy plants close the insight-to-action gap, coordinate frontline maintenance, and turn reliability into bottom-line results.

Unlock Margins Hidden in your Maintenance
Watch how leading manufacturers improve OEE, increase PM compliance, and reduce downtime through connected execution.

- 05-10-2026
10 Best Shift Handover Software Platforms for Plant and Process Operations
Shift handover software can mean different things depending on the operating environment. Some...

- 29-09-2026
Best SAP Maintenance Planning & Scheduling Software 2026
Your maintenance work orders live in SAP Plant Maintenance (PM), while the working schedule lives...

- 28-09-2026
Best Work Order Software: Top 9 Platforms Compared
Selecting the best work order software is a different decision for a large industrial plant than...