
What Is Throughput in Manufacturing?
Throughput is the amount of finished, sellable product a plant produces over a set period of time. It is measured on actual good output, not on the maximum a line could produce in theory. A chemical plant measures it in tons per day, a refinery in barrels per day, and a packaging line in cases per hour.
Throughput counts only good units. It excludes:
- Rejected and reworked units: If raw output rises while throughput stays flat, the gain goes to the scrap bin.
- Work in process: A busy plant is not automatically a productive one, because half-finished batches are not saleable output.
- Theoretical capacity: Throughput is what the plant delivered, not what the nameplate says it could.
This makes throughput a reliable measure of plant performance. If scrap rises, throughput falls, even when the machines are running at full speed. Two plants can run the same equipment for the same hours and report very different throughput, because one converts more of its run time into sellable product.
What Is Throughput in Maintenance, and How Is It Different?
In a maintenance context, throughput has a more specific meaning. Maintenance throughput is the amount of work a maintenance team completes in a given period, measured in work orders closed, labor hours completed, or backlog cleared. Production throughput, described above, is the finished output the plant ships. The two are closely linked.
Maintenance influences production throughput through the factors it controls, and it should not be judged on the factors it does not. Keeping these two groups separate is what makes throughput a fair measure of maintenance performance:
- What maintenance controls: equipment availability, meaning how often assets are ready to run when production needs them, and part of equipment performance, meaning the slow running and minor stops that come from worn or poorly maintained condition.
- What maintenance does not control: customer demand, product mix, the quality and supply of raw materials, and the availability of labor outside the maintenance crew.
When assets run when they are scheduled to run, production throughput rises. When breakdowns and reactive repairs take equipment offline, it falls. This is why maintenance throughput matters: completing the right work, on the right assets, at the right time is one of the few output levers a maintenance leader directly controls.
One caution is important. Completing more work orders does not automatically raise production output. A team can close a high volume of low-value jobs and still lose production hours if the wrong assets were prioritized. The goal is not simply more maintenance work. It is maintenance work targeted at the equipment that limits plant output.
Maintenance Throughput vs Production Throughput: Two Metrics That Get Confused
The two are easy to confuse, so it helps to see them side by side:
|
Aspect |
Maintenance throughput |
Production throughput |
|---|---|---|
|
What it measures |
Work the maintenance team completes |
Finished, sellable goods the plant ships |
|
Typical units |
Work orders closed, labor hours completed, backlog cleared in crew-weeks |
Tons per day, barrels per day, batches per week, cases per hour |
|
Who owns it |
Maintenance |
Production and operations |
|
What raises it |
Completing the right work on the right assets |
Equipment that is available and running to plan |
The Throughput Formula, and the Version Maintenance Leaders Actually Need
Production throughput is calculated by dividing the number of good units produced by the length of the time period. The result is a rate, such as units per hour or tons per day.
| Throughput = Good Units Produced ÷ Time Period |
For example, a packaging line runs for 24 hours and produces 9,200 good cases in that time. Its throughput is about 383 cases per hour. If the line is rated to run at 500 cases per hour, the difference between 500 and 383 represents output lost to downtime, slow running, and quality problems. Much of that lost output is within maintenance’s control.
For day-to-day maintenance planning, a second calculation is more useful. It estimates how much production is put at risk when a specific asset goes down, which helps a planner decide which work orders to complete first. This is sometimes called throughput at risk.
|
Throughput at Risk = Normal Production Rate × Expected Downtime Hours |
Consider two assets. Asset A is a large pump with a high priority code. It runs at 180 units per hour, and a failure would take an estimated 4 hours to repair, putting 720 units at risk. Asset B is a smaller bagging unit with a lower priority code. It runs at 460 units per hour, and the same 4-hour repair would put 1,840 units at risk.
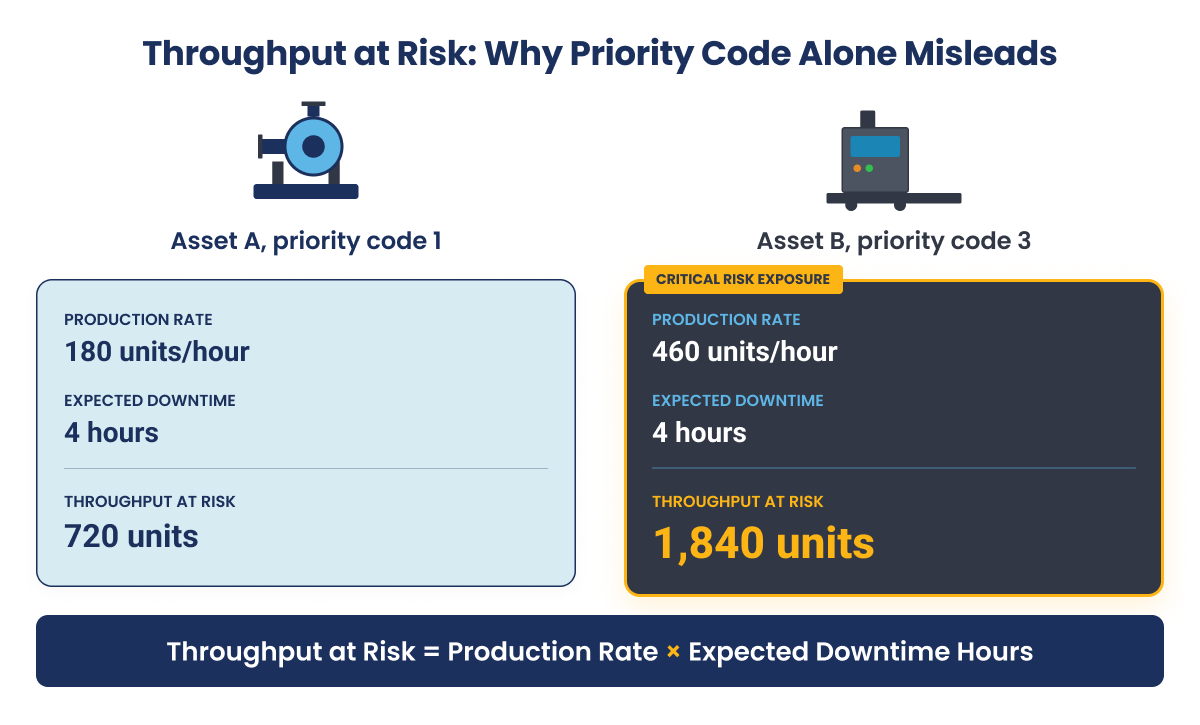
Asset B puts more than twice the production at risk, even though it carries a lower priority code. Priority codes are usually set once and rarely reviewed against current production. Calculating throughput at risk keeps the priority tied to real output, which is the basis for the first strategy below.
Turn maintenance data into higher throughput.
A practical blueprint for moving from reactive, disconnected maintenance to continuous, AI-supported execution.
Why Maintenance Throughput Drops: The Time Between a Problem and Its Fix
Most lost production does not come from the repair itself. It comes from the time that passes between a problem appearing and the repair being completed. On many sites, the hands-on repair is a small part of total downtime. The larger part is waiting: waiting for the problem to be noticed, for a work order to be raised, for parts, for a permit, and for the asset to be handed back to production.
This delay is often called the insight-to-execution gap. The enterprise system, whether SAP Plant Maintenance, IBM Maximo, or Oracle EAM, plans the work correctly. Output is lost in the steps between the plan and the completed job on the plant floor, and each of those steps carries a share of the cost of unplanned downtime. Breaking downtime into its stages shows where the time actually goes:
- Detection: the problem exists but has not yet been reported.
- Reporting: the issue waits until shift change to be logged.
- Prioritization: the work order waits for the next planning meeting.
- Planning: with no job plan ready, a planner has to build one.
- Parts: the part is listed in the system but is not physically ready at the job.
- Permits and isolation: the permit to work and lockout/tagout approvals are still pending.
- Travel: the crew moves to the asset, then back again for a missing tool.
- Repair: the hands-on work, usually the shortest stage.
- Verification and close-out: the fix is confirmed and the work order is closed in the system.
When downtime is recorded as a single number, it is easy to assume the repair took too long. In most cases, the repair was quick and the waiting was long. Shortening the waiting stages returns production hours without adding technicians. Indorama Ventures, a global chemical manufacturer, improved parts availability at the point of work from 55 percent to 95 percent after connecting its field teams to its systems, which removed one of the largest sources of waiting.
Closing this gap is the role of a mobile execution layer. Innovapptive’s connected worker platform carries the work order, instructions, and permit to the technician at the asset and records each step back into SAP, IBM Maximo, or Oracle EAM, which shortens the waiting stages above.
How to Find the Bottleneck That Limits Your Output
The bottleneck is the asset that limits the output of the whole line or plant. It is the point where work builds up in front of one asset while equipment downstream waits, and where the asset runs closest to its maximum capacity. Improving throughput starts here, because an hour recovered on the bottleneck flows straight through to plant output, while an hour recovered elsewhere often does not.
Three signs point to the bottleneck:
- Material or product piles up ahead of one asset while equipment downstream waits.
- The asset appears most often when the plant misses its production plan.
- The asset’s failure stops the line, rather than just slowing it.
The bottleneck is not always the largest or most expensive asset. A single bagging head, screening deck, or transfer conveyor can cap the whole line more often than a large compressor or reactor.
The bottleneck can move as product mix, raw material, or demand changes, so it should be reviewed regularly, for example each quarter or whenever the production plan changes.
9 Maintenance Strategies to Improve Throughput
The strategies below are ordered by how much output they typically recover for the effort involved. Many of them work by reducing cycle time, the time it takes to complete one unit or one maintenance pass, because shorter cycle time drives higher throughput. The first few cost little and work quickly, because they change how work is prioritized and scheduled rather than adding resources. The later ones build over time. No plant should attempt all nine at once. A practical approach is to pilot two or three on the bottleneck asset, measure the result, and expand from there. Applied this way, these strategies increase throughput in manufacturing without adding equipment or headcount.
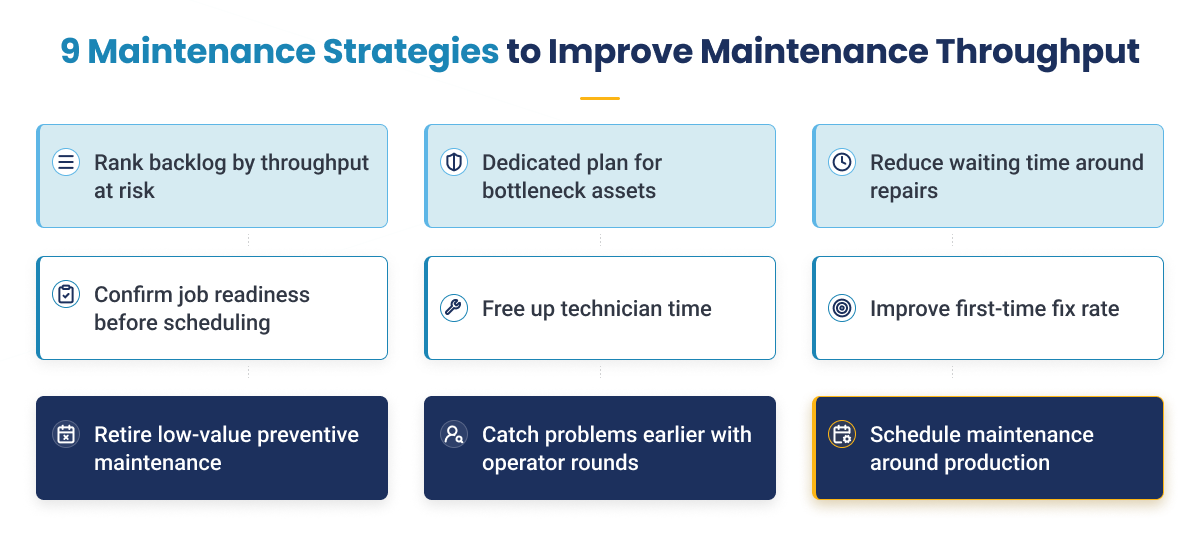
1. Rank the Maintenance Backlog by Throughput at Risk, Not by Priority Code
Re-rank the open maintenance backlog by how much production each job protects, using the throughput at risk calculation shown earlier. Priority codes are usually set once, when the work order is created, and rarely revisited, so they drift out of line with current production needs. Two rules keep the ranking honest:
- Sort by output at risk, not by the original priority code, so the jobs that protect the most production rise to the top automatically.
- Keep safety, regulatory, and compliance work at the top, regardless of production impact.
The same crew, hours, and budget then deliver more output, because the sequence changed. After prioritizing work this way, Indorama Ventures reduced its maintenance backlog from 24 weeks to 10 weeks, a 58 percent reduction.
2. Give Bottleneck Assets a Dedicated Maintenance Plan
Create a separate, stronger maintenance plan for the assets that limit plant output, instead of applying the same standard to every asset. A dedicated plan for a bottleneck asset typically includes:
- Shorter preventive maintenance intervals.
- Condition monitoring in place of fixed, time-based checks.
- Critical spare parts held on site.
- Pre-approved permits and a named crew ready to respond first.
The hours for this can come from within the existing team. Where it is safe to do so, service low-risk assets less often and move those hours to the bottleneck, so no extra headcount is needed. The reason this pays off is direct: an hour of uptime recovered on a bottleneck asset adds straight to plant output, while an hour recovered on a non-critical asset usually does not.
3. Reduce the Waiting Time Around Each Repair
Measure each stage of the repair process separately, from the moment an issue is reported to the moment the work order is closed, then target the stage that takes the longest. Most plants that do this find that waiting time is far greater than hands-on repair time, and that two stages are almost always left unmeasured:
- Prioritization time: how long a reported issue waits before it is ranked and planned.
- Close-out time: how long a finished job stays open in the system, which makes the backlog inaccurate and distorts every prioritization decision that follows.
Cutting one waiting stage in half returns production hours without adding a single technician
4. Confirm Job Readiness Before Scheduling
Do not release a job to the weekly schedule until it is fully ready. A job is ready only when all of the following are confirmed and staged against that specific work order:
- Parts picked, kitted, and staged, not simply listed as in stock somewhere in the storeroom.
- Permits and isolations approved.
- Tools, drawings, and procedures on hand.
Treat this as a firm rule: if a job is not ready, it goes back to the backlog rather than onto the schedule. This prevents a crew taking equipment offline for a repair that then cannot proceed, and every maintenance window opened for a job that cannot be completed is lost production time. Planning and scheduling software, such as Innovapptive’s, can apply this readiness check automatically. Indorama improved parts availability at the point of work from 55 percent to 95 percent, with almost no jobs rescheduled for missing materials.
5. Free Up Technician Time Lost to Paperwork and System Entry
Measure how a technician’s shift is actually spent, then remove the non-productive steps that consume it. Wrench time, the share of a shift a technician spends working directly on equipment, is typically only 25 to 35 percent, against a world-class level of 55 percent or more. Much of the lost time goes to:
- Walking to a shared computer.
- Filling in paper forms and entering the same data twice.
- Closing work orders through several separate system screens.
A single breakdown work order can require six separate transactions in SAP, which a mobile tool can reduce to one screen. Offline-first mobile execution, such as that in Innovapptive’s iMaintenance , lets a technician complete and close a job at the asset without returning to a shared terminal or waiting for a signal. This is also where maintenance overtime is often driven up.
6. Raise First-Time Fix Rate So the Same Failure Stops Taking the Same Hours
Track how often a repair holds without a repeat visit, and treat a repeat failure as a production problem, not a minor inconvenience. When a repair fails, the whole process runs again, plus a second maintenance window, so the cost is more than double the original job. First-time fix rate improves with a few practical steps:
- Clear, failure-specific procedures.
- The correct repair history available at the asset.
- A verification step before the job is closed.
- Knowledge captured from experienced technicians, including photos and short videos taken at the asset.
The most common root cause of repeat failures is knowledge held by only a few experienced technicians. Delivering digital work instructions at the correct revision to the technician at the asset, as Innovapptive’s do, is one practical way to make a repair repeatable. Indorama increased the use of digital work instructions from below 20 percent to 85 percent.
7. Retire Preventive Maintenance That No Longer Adds Value
Review preventive maintenance tasks against what they actually find, and extend or remove routines that repeatedly find nothing wrong. The method is straightforward:
- Compare each routine with the corrective work raised on the same asset since its last check.
- Where a routine has produced no findings over several cycles, extend its interval one step at a time.
- Never extend tasks required by regulation, insurance, or process safety.
This is the one strategy on the list that improves throughput by doing less maintenance, not more, because every preventive task takes up a production window and technician time whether or not it finds a problem. Over-maintenance and under-maintenance both cost output, and the preventive-to-corrective ratio shows which one a plant has. Indorama raised its preventive-to-corrective ratio from below 50 percent to 80 percent. See our guide to preventive maintenance optimization for the full interval method.
8. Catch Problems Earlier Through Operator Rounds
Give machine operators a simple, structured way to catch early warning signs, because they are already standing at the equipment. An effective operator round has three parts:
- A set inspection route.
- A defined list of readings to record.
- A one-tap way to raise a work order the moment a problem appears.
The key is the handoff: an observation should become a photo and a structured work order in the system within seconds, rather than a note passed on at shift change. A trend in readings is more useful than a single reading, because a value that is slowly drifting predicts a failure. Operator rounds software, such as Innovapptive’s, gives operators a guided route and a one-tap path from an observation to a work order. See our guide to total productive maintenance for the operator-led maintenance framework.
9. Schedule Maintenance Around the Production Plan
Plan maintenance windows around the production schedule and demand forecast, not only around when the maintenance crew is available. Group jobs so that a single planned stoppage covers several at once, bundling by:
- Shared downtime window.
- Location or asset proximity.
- Trade or skill, and shared materials.
Add a freeze period so late additions do not disrupt the whole week’s plan. Done well, the number of production interruptions falls even as the number of completed jobs rises. Planning and scheduling software, such as Innovapptive’s, helps group jobs into shared windows and hold the weekly schedule against late changes. Schedule compliance, the share of planned work completed as scheduled, is often only 60 to 65 percent, and low compliance forces the unplanned stoppages that cost the most output. The largest single planned event of the year is the turnaround or shutdown, where any overrun costs far more output than a series of small stops, so protect that plan hardest.
Put these strategies to work on your plant floor.
Discover how connected maintenance execution recovers output from the assets you already run.
How to Measure and Prove a Throughput Improvement Process
Measure throughput at the bottleneck asset, count only good units, and compare over a period long enough for normal swings in product mix to even out. Set up this measurement before the work begins, because a result you cannot clearly tie to maintenance will not hold up in a budget review.
Track each production metric alongside the maintenance metric that should be moving with it. This makes the link between maintenance work and output visible:
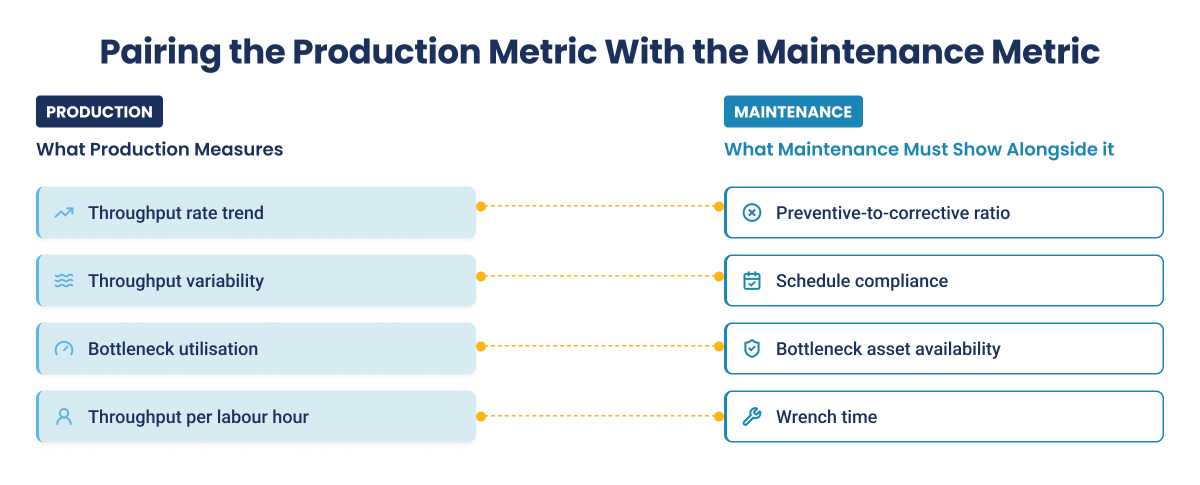
Each pair moves together: planned, well-scheduled work on available bottleneck assets is what turns maintenance effort into steady output. If a production metric improves but its paired maintenance metric has not moved, the gain probably came from something other than maintenance.
Throughput also changes for reasons outside maintenance control, such as customer demand, product mix, and the quality of raw materials. Two steps keep the results credible. First, compare periods with a similar product mix, so the comparison is fair. Second, pair every change in throughput with the maintenance metric expected to drive it. If throughput rose but wrench time did not, the gain cannot be credited to maintenance. As a benchmark, day-to-day throughput variation below 5 percent is considered world-class, 5 to 10 percent is good, 10 to 20 percent is average, and above 20 percent points to an unstable process.
How Improving Maintenance Throughput Reduces Maintenance Cost
Improving maintenance throughput lowers maintenance cost when it means completing more valuable work with the same resources, not adding people, overtime, or contractors to close more work orders. That distinction is the whole point. A useful way to frame it is maintenance cost effectiveness, which is the amount of useful maintenance output divided by total maintenance cost. The goal is to raise output while holding or lowering cost, and while keeping equipment reliable.
When throughput improves the right way, the savings come from a few clear mechanisms:
- More productive technician hours: better planning, parts readiness, and scheduling cut waiting, travel, and search time, so a technician completes more work within the same paid hours.
- Less overtime and contractor use: when the same workload fits inside normal working hours, overtime and outside labor fall.
- Less reactive and emergency work: shifting effort toward preventive, predictive, and reliability-centered maintenance reduces the breakdowns that drive the most expensive repairs.
- Less rework: correct job plans, the right parts, and root-cause analysis raise first-time-fix rate, so the same failure is not paid for twice.
- Lower cost per completed job: with productive hours rising and paid hours flat, the labor cost of each completed job falls.
This mirrors long-standing guidance from the U.S. Department of Energy’s Operations and Maintenance Best Practices Guide, which recommends planning and scheduling work so that materials, tools, and support are ready before a job begins, using reliability-centered maintenance to reach target reliability at the best cost, and feeding root-cause findings back into preventive and predictive maintenance.
There is an important caveat. Higher throughput does not automatically lower total cost. If you close more work orders by adding technicians, overtime, contractors, or inventory, cost can rise. And if the extra work is mostly corrective, you may simply be doing more of the wrong work. The aim is more planned, valuable work completed, with fewer failures, emergencies, and repeat repairs. The table below shows why the type of throughput gain matters:
|
What changes |
Likely effect on cost |
|---|---|
|
More work completed through better planning and less waiting |
Lower cost per work order |
|
Faster repairs with no loss of quality |
Lower downtime and labor cost |
|
More preventive maintenance added without reviewing task value |
Cost can rise |
|
More work orders closed with superficial repairs |
Higher repeat-failure cost |
|
Higher throughput focused on critical assets |
Usually the strongest saving |
Indorama Ventures: A Throughput-Led Program That Cut Maintenance Cost
Indorama Ventures shows what this looks like in practice. The global chemical manufacturer ran its Port Neches, Texas site with a reactive maintenance culture: a preventive-to-corrective ratio below 50 percent, a 24-week backlog, and heavy use of contractors and overtime, despite existing investment in SAP PM and IBM Maximo. By moving technicians onto mobile execution, improving parts readiness, and prioritizing the work that protected the most output, the site completed more planned work without adding people. The cost results followed within 12 months:
|
Metric |
Before |
After |
|---|---|---|
|
Preventive-to-corrective ratio |
45% |
80% |
|
Maintenance backlog |
24 weeks |
10 weeks |
|
Contractor headcount |
140 |
87 (38% lower) |
|
Overtime |
24% |
12% (halved) |
|
Parts availability at the job |
55% |
95% |
Together these changes contributed to 29 million dollars in maintenance savings in 2025, with a further 50 million dollars in cost-reduction opportunity identified for a wider rollout. The savings did not come from doing more maintenance. They came from completing the right work more efficiently: fewer breakdowns to chase, fewer contractor hours, less overtime, and less rework. To track the same effect in your own plant, watch maintenance cost per production unit, overtime, and contractor spend alongside completed work orders, and see our guide to reducing maintenance costs for the full method.
See how Indorama Ventures cut its maintenance backlog by 58 percent and unlocked 50 million dollars in savings.
Discover how a connected worker approach moved the needle on reliability, workforce productivity, and maintenance cost.
What a Throughput-Led Maintenance Program Actually Delivers
When a plant runs maintenance as a throughput program, prioritizing work by output at risk, gating jobs on readiness, and protecting the bottleneck, the payoff shows up in four areas:
- Recovered capacity and output: the same assets produce more, because less time is lost to waiting and unplanned stops.
- More predictable output: fewer surprise breakdowns mean the plant hits its production plan more consistently, which matters as much as the average rate.
- Lower maintenance cost: less overtime, fewer contractor hours, and less rework, as covered in the cost section above.
- Better reliability and safety: a shift from reactive to planned work means fewer emergencies and safer, better-prepared jobs.
Sabert Corporation, a global food packaging manufacturer, shows the capacity outcome clearly. Facing record demand that its equipment could not keep up with, it connected maintenance execution across more than five sites, recovered 9,000 hours of unplanned downtime a year, and freed up enough capacity to avoid building two new production lines. That saved 16 million dollars in capital spending. The same assets delivered more output once execution improved.
This connected-worker approach also has outside validation. Frost & Sullivan named Innovapptive its 2026 Company of the Year for Global Augmented Connected Worker platforms, recognizing its impact across maintenance, operations, and reliability.
How Innovapptive Helps Improve Maintenance Throughput
Innovapptive’s Mobile Maintenance Software digitizes maintenance execution on a mobile device and connects it to the enterprise system a plant already runs, whether SAP Plant Maintenance, IBM Maximo, or Oracle EAM. It is built for asset-heavy industries such as oil and gas, chemicals, mining, and heavy manufacturing, where slow execution between the system and the field is the main cause of lost output. It works as a mobile execution layer on top of the system of record, closing the gap between the maintenance plan and the work carried out in the field, which is exactly where most throughput is lost. A plant improves execution this way without a costly or disruptive system replacement.
The capabilities map directly to the strategies above:
- Mobile work order execution, so technicians receive, complete, and close work at the asset instead of walking to a shared computer, which raises wrench time.
- AI-assisted work order creation, so a technician can raise a work order from a photo or a short prompt in seconds, with clean equipment data.
- Offline-first sync, so work continues in low-signal and intrinsically safe areas and syncs back to the enterprise system within minutes.
- Digital work instructions, permits, and safety controls attached to the job, which support first-time fixes and safe execution.
- Real-time supervisor dashboards, showing work status, backlog, and asset health, so the shift can be run from the plant floor.
- Root cause capture and repair history at the asset, which reduces repeat failures.
These capabilities run on a wider connected worker platform that includes a set of purpose-built AI agents for maintenance, safety, and reliability work, covering tasks such as fault detection, guided troubleshooting, and root cause analysis. Across mature deployments, the platform is designed to deliver a 15 to 20 percent improvement in workforce productivity and a 20 to 30 percent reduction in unplanned downtime.
Recover the output your plant already pays for.
See how a connected worker approach lifts wrench time, cuts backlog, and turns maintenance execution into measurable throughput, on top of the system you already run.

Unlock Margins Hidden in your Maintenance
Watch how leading manufacturers improve OEE, increase PM compliance, and reduce downtime through connected execution.
- 12-10-2026
Manufacturing Skills Gap: What It Costs and How to Close It
A plant can have every role filled and still experience a manufacturing skills gap. Very often,...

- 05-10-2026
10 Best Shift Handover Software Platforms for Plant and Process Operations
Shift handover software can mean different things depending on the operating environment. Some...

- 29-09-2026
Best SAP Maintenance Planning & Scheduling Software 2026
Your maintenance work orders live in SAP Plant Maintenance (PM), while the working schedule lives...