
What Is Unplanned Downtime?
Unplanned downtime is the period when an asset, production line or process unit is unable to perform its intended function during scheduled operating hours because of an equipment failure, process interruption or another event that was not planned in advance. It is generally measured in hours and reported as a percentage of scheduled run time.
The term is used interchangeably with unscheduled downtime. In power generation and utilities, an unexpected stop of an entire unit may be described as an unplanned outage or a forced outage.
The International Electrotechnical Vocabulary (IEC 60050-192) provides standard terminology for equipment downtime and distinguishes equipment-related unavailability from external conditions that prevent operation. This distinction is useful in manufacturing because an asset can be unavailable without stopping the production unit, while a utility or material disruption can stop production even when no individual machine has failed.
The production schedule provides the reference point: a stoppage qualifies when the asset or line was scheduled to operate and the interruption was not planned. Three situations should be distinguished from unplanned downtime:
- Planned downtime: A preventive maintenance window, statutory inspection or turnaround scheduled in advance is planned downtime. It is removed from scheduled run time before the percentage is calculated.
- Unscheduled hours: Periods when production was never planned, such as weekends at a five-day site or periods without customer orders, are idle time rather than downtime.
- Reduced-rate operation: If an asset continues to run below its normal output, the shortfall is a performance loss rather than downtime.
Unplanned Downtime vs Unplanned Maintenance
Unplanned downtime measures lost operating time, while unplanned maintenance measures repair work that had to be carried out without prior planning. The two are closely related, but either can occur without the other.
|
Aspect |
Unplanned downtime |
Unplanned maintenance |
|---|---|---|
|
What it measures |
Hours an asset or line cannot operate during scheduled time. |
Repair work carried out without a prior job plan. |
|
Unit of measure |
Hours, or a percentage of scheduled run time. |
Work orders, maintenance hours or share of total maintenance work. |
|
Primary owner |
Operations and plant leadership. |
Maintenance and reliability teams. |
|
Main impact |
Lost production and throughput. |
Disrupted maintenance schedules and higher maintenance effort. |
|
Can it occur without the other? |
Yes. A late feedstock delivery can stop a unit without any repair. |
Yes. An installed spare can take over while the failed pump is repaired, so production continues. |
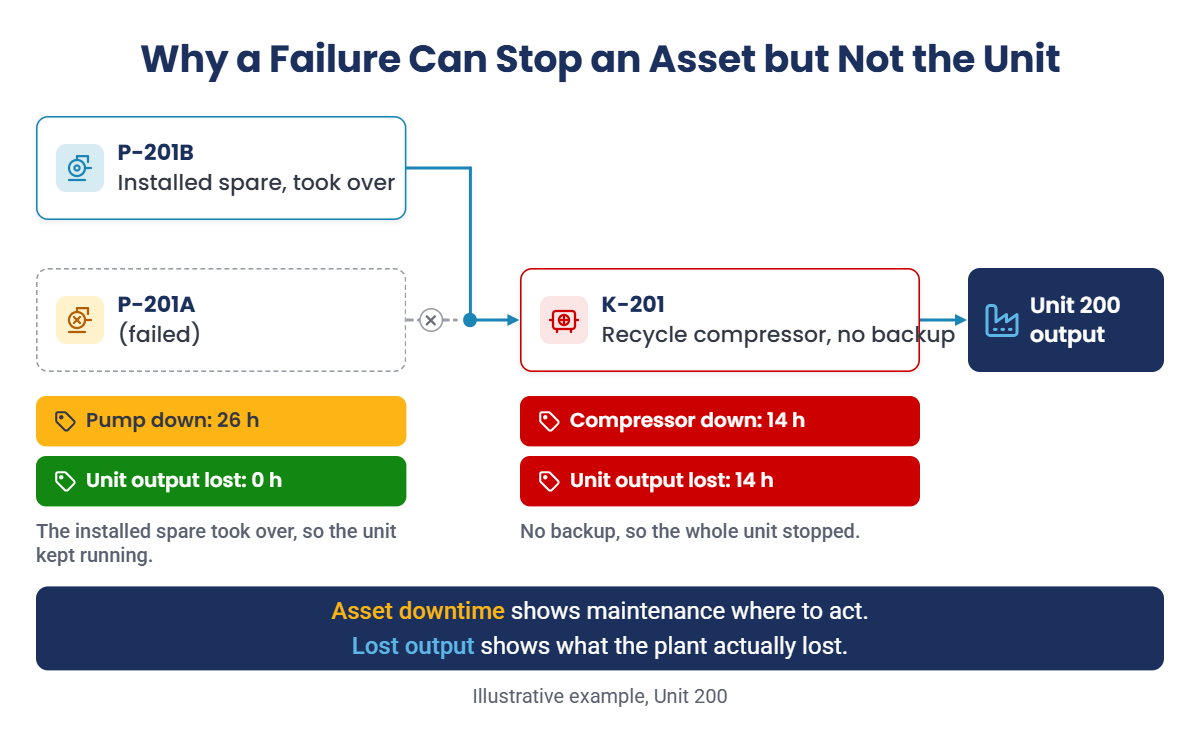
Unit 200, an illustrative continuous chemical unit used for the examples in this article, shows all three combinations. The unit depends on a single recycle compressor, K-201, which has no backup, and on a charge pump, P-201A, which has an installed spare, P-201B.
- Maintenance without downtime: The mechanical seal on P-201A fails. P-201B takes over, the unit keeps running and P-201A is repaired without any loss of production.
- Downtime without maintenance: A feedstock delivery arrives 8 hours late and the unit stands idle, although no equipment has failed.
- Both together: K-201 trips on high vibration from a failing bearing, and the unit remains down until the bearing is replaced.
What Causes Unplanned Downtime?
The causes of unplanned downtime generally fall into two groups: a failure within the asset, or a disruption to something the asset needs in order to operate. Equipment failures fall mainly to maintenance and reliability teams, while external causes usually require coordination across operations, supply chain, instrumentation and site services. Grouping stoppages by origin and totaling the hours in each group shows where corrective action will have the greatest effect.
| Cause group | Typical examples in process plants | Functions typically involved | Records to review |
|---|---|---|---|
| Equipment failure | Worn bearings, seal leaks, motor failures, gearbox damage, fouled heat exchangers | Maintenance and reliability | Asset failure codes, work history and repeat-failure records. |
| Maintenance error | Incorrectly fitted parts, missed or late preventive maintenance, planned work that overruns | Maintenance planning, supervisors and execution teams | Work-order history, job closeout records and PM completion. |
| Operating error | Incorrect startup sequence, operation beyond design limits, missed checks during rounds | Operations and shift supervision | Shift logs, operating records and operator-round exceptions. |
| Controls and instrumentation | Faulty transmitters, PLC faults, false trips, loss of network communication | Instrumentation and controls | Alarm history, trip logs and instrument records. |
| Materials and supply | Late or off-specification feedstock, packaging shortages, spare parts out of stock | Supply chain, procurement, stores and operations | Production schedule, inventory records and material requests. |
| Utilities and external events | Power dips, loss of steam, cooling water or instrument air, severe weather | Utilities, site services and plant management | Utility records, site event logs and weather reports. |
Why Downtime Analysis Starts With Clean Maintenance Data
Cause analysis is only as reliable as the failure codes and work history behind it. See a practical blueprint for using AI to standardize maintenance data and close the loop from field observation to completed work.
Unplanned Downtime Examples in Manufacturing and Process Plants
The examples below show how unexpected events affect different assets and production systems. They also illustrate why an equipment stoppage does not always result in production downtime.
Illustrative examples
|
Industry |
Event |
Cause group |
Affected asset or operation |
Unplanned downtime recorded |
|---|---|---|---|---|
|
Refining |
A charge pump mechanical seal fails, and the installed spare pump takes over. |
Equipment failure |
The failed pump only, while the unit continues operating. |
26 hours on the pump, none on the unit |
|
Chemicals |
A recycle compressor trips on high vibration from a failing bearing. |
Equipment failure |
The process unit stops because the compressor is a single-train asset. |
14 hours |
|
Mining |
An overland conveyor gearbox fails. |
Equipment failure |
The crushing and conveying circuit is interrupted. |
11 hours |
|
Upstream oil and gas |
A gas lift compressor shuts down on a control system fault. |
Controls and instrumentation |
Production from the connected wells is interrupted. |
6 hours |
|
Power generation |
A boiler feed pump trips and the generating unit reduces load rather than stopping. |
Equipment failure |
The generating unit, which continues at reduced output. |
0 hours, with the shortfall recorded as a performance loss |
|
Consumer goods packaging |
A filling line stops because an inbound packaging-film delivery is late. |
Materials and supply |
The filling line is unable to continue production. |
5 hours, with no maintenance repair required |
|
Metals |
A hydraulic hose on a rolling mill bursts and is repaired immediately because of fire risk. |
Equipment failure |
The mill stops while the hose is replaced and the process is restarted. |
4 hours, plus restart time |
In two of these cases, equipment failed, but production continued because an installed spare took over or the unit continued at partial load. On the packaging line, production stopped although no equipment failed. These differences are why unplanned downtime has to be defined against the production schedule, separated clearly from planned stoppages and measured at a stated level, either for a single asset or for the line or unit as a whole.
Planned vs Unplanned Downtime: The Two Types of Downtime
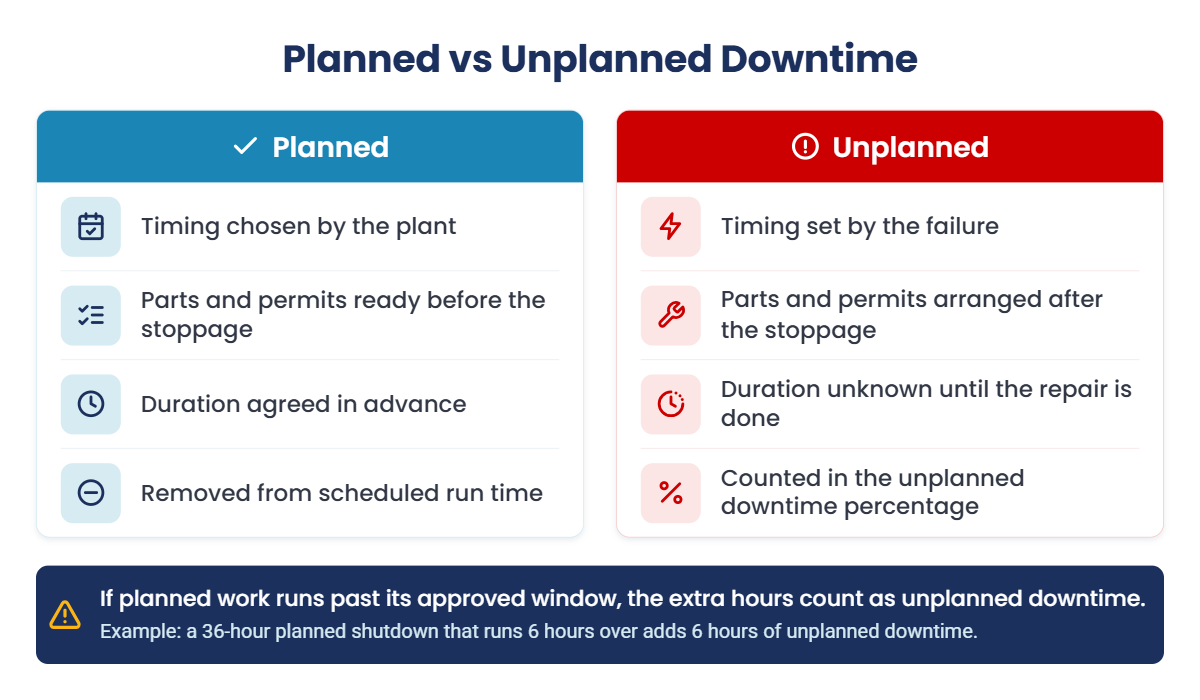
Downtime is commonly classified as planned or unplanned based on whether the interruption was scheduled in advance. Planned downtime is a stoppage scheduled in advance, such as a preventive maintenance window, a product changeover or a turnaround. Unplanned downtime results from a failure or other event that interrupts scheduled operation without prior planning. The distinction also determines how each type is treated when unplanned downtime is calculated.
|
Aspect |
Planned downtime |
Unplanned downtime |
|---|---|---|
|
Timing |
Agreed in advance between maintenance and operations, usually around production demand. |
An unexpected failure or external event determines when the interruption occurs. |
|
Advance notice |
Usually days or months, depending on the work. |
Little or no advance notice. |
|
Work order preparation |
Job plans, parts, permits and isolation arranged before the stoppage. |
Diagnosis, parts, permits and isolation arranged after the stoppage. |
|
Duration |
The stop has an approved window and planned return-to-service time. |
Duration depends on diagnosis, access, parts and restoration work. |
|
Effect on the maintenance schedule |
The work is included in the maintenance plan. |
Urgent work can displace inspections, PMs and other scheduled jobs. |
|
Treatment in the calculation |
Excluded from scheduled run time. |
Counted as unplanned downtime hours. |
|
Typical reporting |
Planned maintenance or outage hours. |
Unplanned downtime percentage, and availability loss in OEE calculations. |
Common forms of planned downtime include preventive maintenance windows, statutory inspections, product changeovers and major turnarounds. If a planned maintenance window exceeds its approved duration, only the extra time is treated as unplanned, provided the asset was scheduled to operate during that period.
The balance between planned and unplanned work has a measurable effect on lost production time. NIST's research on manufacturing machinery maintenance, an analysis of US discrete manufacturers, found that establishments in the top quarter for reliance on reactive maintenance reported 3.3 times more downtime than those in the bottom quarter.
How to Calculate Unplanned Downtime as a Percentage of Scheduled Time
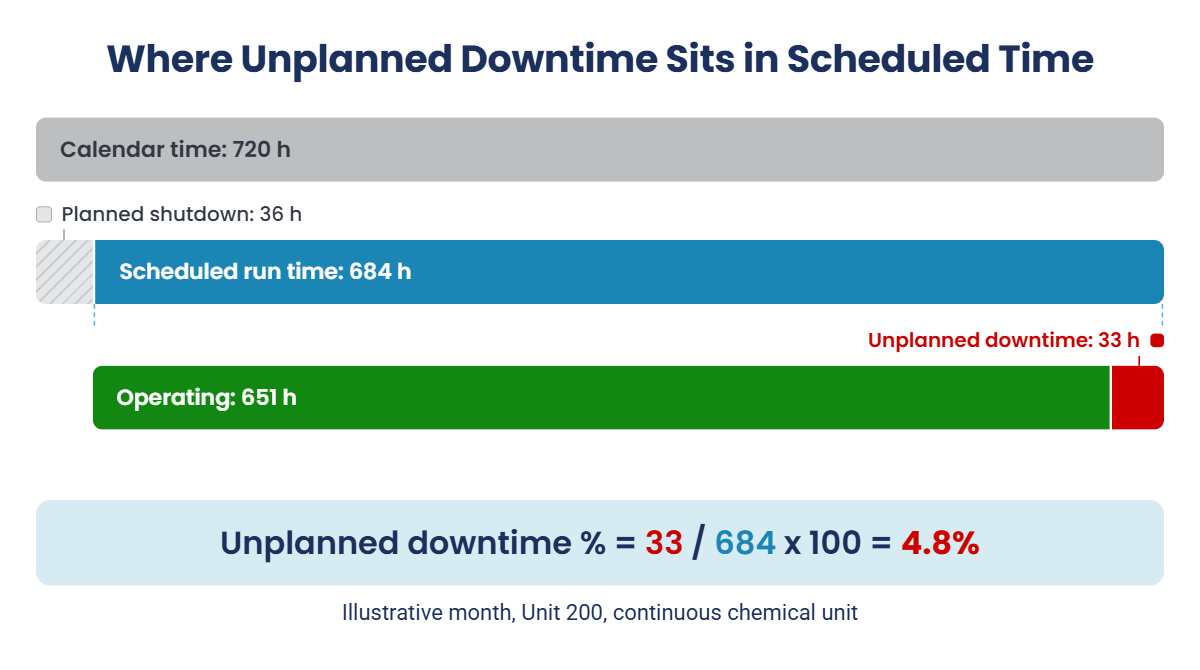
Calculate unplanned downtime as a percentage by dividing the hours of unplanned downtime by the hours the asset or line was scheduled to operate, then multiplying by 100.
|
Unplanned downtime % = (Unplanned downtime hours / Scheduled run time hours) x 100 |
Accurate calculation depends on consistent definitions for both values, and on keeping scheduled run time distinct from calendar time:
- Calendar time is every hour in the period, 24 hours a day, whether or not production was planned. A 30-day month has 720 calendar hours.
- Scheduled run time is the portion of calendar time during which the asset or line was scheduled to produce. It excludes planned shutdowns, preventive maintenance windows and hours with no production scheduled. Manufacturing KPI standards such as ISO 22400-2 call this value planned busy time, and OEE calculations call it planned production time.
- Unplanned downtime hours are the hours within scheduled run time during which the asset or line was stopped for an unplanned reason. Each stoppage is counted from the moment operation stops until the asset is back in service.
Scheduled run time is also the basis of APQC's unplanned machine and equipment downtime measure, one of the most widely referenced benchmarks for this metric. The measure excludes preventive maintenance, setup and changeover, so it reflects only stoppages that were not planned.
The calculation follows four steps:
- Select the reporting period and the level being measured: one asset, a production line or an entire process unit.
- Calculate scheduled run time from the production schedule. Do not use calendar hours unless the asset was scheduled to operate for every hour in the period.
- Add the unplanned downtime hours using consistent rules for stoppages, waiting time, planned-window overruns and external interruptions.
- Divide unplanned downtime hours by scheduled run time hours and multiply by 100. When reporting the result, state the level of measurement and the time base used.
Calendar time is every hour in the reporting period. Scheduled run time is the portion of those hours when the asset or line was expected to operate, after planned downtime and other non-operating periods are removed. The same number of unplanned downtime hours will therefore produce different percentages when these two denominators are used.
For the packaging line, 12 hours of unplanned downtime represents 3.8% of the time the line was scheduled to produce. Measured against calendar time, which includes nights and weekends when the line was not scheduled, the same 12 hours appears as 1.8%, less than half the actual rate. Unit 200 is scheduled for almost every hour of the month, so the two bases give similar results. Because the base can change the result this much, unplanned downtime percentages are comparable only when they use the same base. Uptime follows the same logic: uptime and unplanned downtime add up to 100% only when planned downtime has already been removed from the base.
For a shift-based line, using calendar time dilutes the result because many hours were never scheduled for production. For a continuous process unit, the difference is smaller because most hours are scheduled. A useful comparison therefore states the denominator as well as the percentage.
| Operation | Calendar time | Scheduled run time | Unplanned downtime | % of scheduled run time | % of calendar time |
|---|---|---|---|---|---|
| Packaging line on two 8-hour shifts, five days a week, over four weeks | 672 hours | 320 hours | 12 hours | 12 / 320 = 3.8% | 12 / 672 = 1.8% |
| Unit 200, a continuous chemical unit, over a 30-day month with a 36-hour planned shutdown | 720 hours | 684 hours | 33 hours | 33 / 684 = 4.8% | 33 / 720 = 4.6% |
What Counts as Unplanned Downtime and What Does Not
Inconsistent recording practices can understate unplanned downtime, particularly when waiting time, overruns on planned work and short stops are left out of the record. Applying the same counting rules every period, and documenting them, keeps the metric comparable over time, because any change to the rules changes the trend regardless of actual plant performance.
|
Situation |
Treatment |
Reason |
|---|---|---|
|
An asset fails, trips or faults during scheduled hours |
Included, from the time of the stoppage until the asset returns to service. |
This is the core definition of unplanned downtime. |
|
Waiting for a technician, spare part, permit or isolation after a stoppage |
Included for the full period while the asset remains unavailable. |
The metric measures the time the asset is unavailable, not the time spent on the repair. |
|
A planned shutdown or maintenance window completed within its approved duration |
Excluded from scheduled run time. |
It is planned downtime. |
|
Planned work that runs beyond its approved window |
Only the hours beyond the approved window are counted, provided production was scheduled to resume. |
The additional hours were not part of the plan. |
|
Setup or changeover within its standard duration |
Excluded and reported as changeover time. |
APQC's machine and equipment measure excludes setup and changeover. OEE may treat changeover as an availability loss under its own definition. |
|
A stoppage caused by missing feedstock, packaging, staff or utilities |
Included at production level, but excluded at equipment level if the equipment itself remains available. |
The production process is interrupted even though no individual machine may have failed. |
|
Operation at a reduced rate |
Excluded. The output shortfall is recorded as a performance loss. |
The asset is still operating, so the shortfall is a performance loss. |
|
Short stops below a defined threshold, such as five minutes |
Recorded separately as minor stops. |
The threshold should remain fixed so the trend is not changed by inconsistent logging. |
|
Hours with no production scheduled |
Excluded. |
They fall outside scheduled run time. |
Accurate counting also depends on knowing when each stoppage began. In one Innovapptive maintenance latency diagnostic review, a malfunction start time was recorded in around 25% of notifications. This is an observation from those diagnostics rather than an industry average, but it shows how often stoppage start times are estimated later, which reduces the reliability of the downtime record.
Worked Example: One Month at a Continuous Chemical Unit
Unit 200 reported steady output for the month, yet five separate events took either the unit or one of its key assets out of service.
Unit 200 recorded 33 hours of production-level unplanned downtime during a 30-day month. The same event log also showed an asset failure that did not interrupt production because a standby pump was available.
Illustrative assumptions
| Item | Value |
|---|---|
| Calendar hours in the month | 720 (30 days) |
| Planned shutdown for heat exchanger cleaning | 36 hours |
| Scheduled run time | 684 hours |
|
Event |
Cause group |
Unit downtime (hours) |
Downtime on the failed asset (hours) |
|---|---|---|---|
|
Recycle compressor K-201 trips because of a failing bearing |
Equipment failure |
14 |
14 |
|
The seal on charge pump P-201A fails, and spare P-201B takes over |
Equipment failure |
0 |
26 |
|
A grid voltage dip trips motors across the unit, and restart takes 5 hours |
Utilities |
5 |
0 |
|
Feedstock arrives 8 hours late |
Materials and supply |
8 |
0 |
|
The planned shutdown runs 6 hours over its approved window because a replacement gasket is the wrong size |
Maintenance error |
6 |
6 |
|
Total |
33 |
46 |
The unit total of 33 hours is made up of 14 hours from the compressor trip, 5 hours from the voltage dip, 8 hours from the late feedstock and 6 hours from the shutdown overrun. The 26 hours on P-201A appear only in the equipment column, because P-201B kept the unit running.
The resulting measures are:
- Production-level unplanned downtime: 33 / 684 x 100 = 4.8% of scheduled run time.
- Equipment-level downtime for P-201A: 26 / 684 x 100 = 3.8%, assuming the pump was scheduled for the same 684-hour period. The spare pump prevented a production-level stoppage.
- Equipment and maintenance share: Equipment and maintenance events account for 20 of the 33 production-level downtime hours: 14 hours on K-201 and 6 hours of maintenance-window overrun. The remaining 13 hours came from utility and material disruptions.
- Unit uptime: 651 / 684 x 100 = 95.2% of scheduled run time.
This example shows why one site may need more than one downtime measure. The unit-level percentage describes lost production time, while the asset record identifies equipment that was unavailable even when production continued.
Equipment-Level vs Production-Level Unplanned Downtime
Unplanned downtime can be measured for an individual asset or for the line or unit that the asset serves, and the two measures answer different questions.
In the Unit 200 example, charge pump P-201A was unavailable for 26 hours, but the process unit recorded no production downtime from that event because standby pump P-201B took over. Equipment-level and production-level downtime describe different operational effects.
- Equipment-level unplanned downtime measures the time an individual asset is unavailable during its scheduled operating hours. Maintenance and reliability teams use it to identify asset-specific failures, repeat events and maintenance priorities.
- Production-level unplanned downtime measures the time a line or unit cannot produce during scheduled hours, regardless of whether the cause is an equipment failure, material shortage, utility interruption or another external event.
Redundancy, installed spares and buffer capacity can prevent an asset failure from interrupting production. In the other direction, a supply or utility disruption can stop a line even when its equipment remains available. On a single-train bottleneck asset with no backup, an asset stoppage may also stop the process unit for the same period.
Frequency and Duration: What Is Driving the Percentage?
Two units can report the same unplanned downtime percentage for different reasons. Unplanned downtime hours are the product of two factors: how often unplanned stops occur and how long each stop lasts.
|
Unit |
Unplanned stops in the month |
Average hours per stop |
Unplanned downtime |
% of 684 scheduled hours |
|---|---|---|---|---|
|
Unit A |
20 |
1.7 |
34 hours |
5.0% |
|
Unit B |
2 |
17 |
34 hours |
5.0% |
Unit A loses its time through frequent short stops, while Unit B loses the same time through two long ones. Each pattern points to a different improvement focus:
- Frequent stops indicate a reliability problem: Mean time between failures (MTBF), the average operating time between one failure and the next, is the measure most often used to monitor it. Improvement typically comes from detecting defects earlier, improving the quality of preventive maintenance and eliminating repeat failures.
- Long stops indicate a response and repair problem: Mean time to repair (MTTR), the average time needed to restore an asset after a failure, is the corresponding measure. Improvement typically comes from reducing the delays between the stoppage and the restart, such as diagnosis, permits and isolation, parts availability and handover between shifts.
Once the frequency and duration components are understood, the percentage can be compared with a benchmark and the site's own performance trend.
Put a Margin Figure on Your Unplanned Downtime
Late notifications, estimated start times and uncounted waits can understate the real loss. Innovapptive’s value engineers review the work orders and notifications at your site and connect each gap to a margin figure your leadership can act on.
What Is a Good Unplanned Downtime Percentage?
There is no universal target for unplanned downtime, but published benchmarks provide a useful reference point. APQC's cross-industry benchmarks report the following medians, both measured as a percentage of scheduled run time:
|
Measure |
Level |
Median |
Organizations in the sample |
|---|---|---|---|
|
Unplanned machine and equipment downtime |
Equipment level |
5.0% |
5,161 |
|
Unplanned general production downtime, from all causes |
Production level |
6.0% |
1,942 |
These figures are cross-industry medians, not manufacturing-only averages or prescribed performance targets. Results vary with asset criticality, redundancy, production schedule, process type and the measurement level. Compare equipment results with equipment benchmarks and production results with production benchmarks.
For an asset scheduled to operate continuously throughout a 365-day year, one percentage point of downtime represents 87.6 hours (1% of 8,760 scheduled hours). This conversion applies only when all 8,760 hours are scheduled operating time.
The strongest comparison combines a consistent 12-month site trend with an external benchmark that uses the same denominator and measurement level. Results can be read against these medians as follows:
| Your result | How to interpret it | What to review |
|---|---|---|
| Below the relevant median | The result is lower than the cross-industry midpoint. It does not, by itself, establish that the plant is a top performer. | Confirm that events, waiting time and planned-window overruns are captured consistently. |
| Near the relevant median | The result is close to the published cross-industry reference point. | Separate the percentage into stop frequency and average duration, then compare the 12-month trend. |
| Above the relevant median | The result is higher than the cross-industry midpoint and may warrant a closer review. | Prioritize bottleneck assets, repeat failures, long restoration periods and disruptions from materials or utilities. |
What a Board-Ready Downtime Business Case Looks Like
A benchmark shows how your downtime compares. The sample Margin Walkthrough report shows how a site’s execution gaps are ranked by margin impact and turned into an ROI model built on its own data.
What Unplanned Downtime Does to Throughput and the Maintenance Schedule
When a bottleneck asset stops, the plant can lose output that it may not be able to recover later in the production schedule. The repair can also pull technicians away from planned work, so the same event can affect current throughput and delay maintenance intended to protect other assets.
The impact typically appears in four areas:
- Lost output on bottleneck assets: The production rate of the bottleneck asset determines how much output is lost during a stoppage. Stoppages on other assets can often be absorbed by buffers or spare capacity, which is why efforts to improve throughput in maintenance focus first on bottleneck assets.
- Restart losses: After equipment is returned to service, the process may need time to stabilize, complete quality checks and return to its target rate. Output produced during this period may be below specification or below the planned rate.
- Deferred planned work: An urgent repair can reassign technicians from scheduled preventive work or inspections. Deferred tasks remain in the maintenance backlog and may leave known equipment issues unresolved.
- Safety exposure: Unexpected stops and restarts can create non-routine work. Permit reviews, isolation, lockout/tagout and other required controls still need to be completed before the repair proceeds, often under time pressure.
At Sabert, a food-packaging manufacturer, record demand exposed approximately 27,000 hours of annual unplanned downtime across its thermoforming lines. Recovering 9,000 of those hours each year restored capacity equivalent to two production lines, without building new lines.
Each of these effects is first measured in hours or units of output. Converted into financial terms, they make up the cost of unplanned downtime in manufacturing, which is why an accurate count of downtime hours is the starting point for any financial estimate.
Where Plants Start When the Number Is Too High
Evidence from US discrete manufacturing highlights the relationship between maintenance strategy and downtime. A 2021 NIST survey and analysis of maintenance in manufacturing machinery found that establishments relying more heavily on preventive and predictive maintenance reported 52.7% less unplanned downtime than those relying more on reactive maintenance. Among the establishments that relied on planned approaches, those leaning toward predictive maintenance reported 18.5% less unplanned downtime than those leaning toward preventive maintenance. The larger gain comes from reducing reliance on reactive work, and predictive methods add value when the plant can plan, prepare and carry out the work they identify.
Plants that reduce unplanned downtime successfully usually start with their bottleneck assets and with whichever factor, stop frequency or stop duration, contributes most to their result. Their efforts generally fall into three areas:
- Reducing stop frequency: Detecting defects early enough to plan the repair, through condition-based maintenance, and eliminating repeat failures through root cause analysis.
- Reducing stop duration: Shortening the time between a stoppage and the restart. Efforts to improve equipment uptime often begin by breaking repair time into its stages, such as diagnosis, permits and isolation, waiting for parts and shift handover, and then addressing the longest delay first.
- Protecting planned work: When emergency repairs take priority, preventive maintenance is deferred and the risk of new failures rises. Holding to the weekly maintenance schedule, measured through schedule compliance, the share of scheduled work completed as planned, protects that work.
Sabert: Recovering Line Capacity Through Mobile Maintenance Execution
At Sabert, the capacity lost to unplanned downtime traced back to maintenance data. Technicians had to walk to a desktop kiosk to record work in SAP, so about 40% of work order information was captured hours or days after the work was done, often without failure codes, root causes or repair times. Without that history, reliability engineers could not see failure patterns, and maintenance remained reactive.
Sabert deployed Innovapptive's mobile maintenance execution and structured digital forms across more than five sites, so technicians recorded work at the point of execution and SAP received complete records. With reliable data in place, the team detected more than 140 potential downtime events early, before they stopped production. The line capacity recovered through lower unplanned downtime allowed Sabert to avoid $16 million in capital spending on new production lines.
How Sabert Recovered Two Lines of Capacity Without Building New Ones
About 40% of Sabert’s work order information was entered hours or days after the work. See how closing that gap recovered 9,000 hours of production a year.
How Innovapptive Helps Plant Teams Cut Unplanned Downtime
Reducing downtime depends on how effectively a plant connects field observations with maintenance planning, parts readiness, permits and work execution. Innovapptive is an industrial execution platform that connects frontline maintenance and operations work with the enterprise systems a plant already runs, such as SAP PM, IBM Maximo or Oracle. Notifications, work orders, confirmations and failure data remain in the system of record, while operators and technicians work on mobile devices in the field. The platform is designed to close the insight-to-action gap, the time between detecting a problem and completing the right work, which is where much of the duration of an unplanned stoppage accumulates. It supports each stage of that sequence:
- Identifying issues at the point of work: With operator rounds software, operators can capture readings, photos and exceptions at the asset, including in areas with limited connectivity. When a reading moves outside its limits, the issue becomes a notification in the ERP while there is still time to plan the repair, so fewer developing problems reach the point of an unplanned stoppage. This gives maintenance teams a more complete record of the issue while it is being reported, rather than relying on information entered after the event.
- Creating and packaging the work: Innovapptive's work order software uses WorkSmartAI to turn a photo, voice note or short description into a structured notification or work order and to identify the affected equipment. The stoppage is recorded with its actual start time, which keeps the downtime record accurate.
- Confirming parts and permits: Spare parts management software picks and stages the required parts against the released work order, and electronic permit to work software (iPermits) prepares the permit from historical permit data and safety rules, with job hazard analysis and isolation linked to the same job. Both steps remove common waits between diagnosis and a safe start.
- Executing the repair: Mobile maintenance software gives technicians the work order, instructions, permit status and parts information on one device, including in areas without connectivity. A QR scan opens Asset 360, which shows the asset's runtime, downtime, maintenance frequency and failure trend, and AI Troubleshooting, one of the platform's 15 AI agents, suggests likely fixes based on equipment history. Confirmations post back to the ERP as the work is completed.
- Keeping field execution and shift handover connected: Shift handover software builds the shift log from field data, so unfinished work and open issues pass to the next shift as tracked items rather than verbal notes. This reduces the risk that an unresolved issue is missed during a handover. Asset information and completed work can then be synchronized with the ERP or EAM record.
How Indorama Ventures Shifted from Reactive to Planned Maintenance
Indorama Ventures, a global chemical manufacturer, faced a largely reactive maintenance environment at its site in Port Neches, Texas. Despite established SAP and IBM Maximo systems, frontline maintenance was largely paper-based. Less than half of the site's maintenance work was preventive, and the maintenance backlog had grown to 24 weeks, affecting asset availability.
After the site digitized work orders, operator rounds and inventory management on Innovapptive's Connected Worker Platform, its PM-to-CM ratio, the share of preventive work against corrective work, rose from 45% to 80%, and the maintenance backlog fell from 24 weeks to 10. The shift at Port Neches follows the pattern in the NIST research: as a larger share of maintenance is planned, fewer failures interrupt production and the maintenance schedule.
Cut the Waits That Turn a Fault Into Hours of Downtime
Diagnosis, permits, parts and handovers account for much of an unplanned stoppage. See how Innovapptive’s industrial execution platform, running on your existing ERP, shortens each step.

Unlock Margins Hidden in Your Maintenance
Watch how leading manufacturers improve OEE, raise PM compliance and cut downtime through connected execution.
Request a Demo
2026 Company of the Year, Global Connected Worker Platforms
See why Frost & Sullivan recognized Innovapptive for closing the frontline execution gap.
Read the Report
- 19-11-2026
Unplanned Downtime: Definition, Causes, Examples, Formula
Unplanned downtime is the time an asset, production line or process unit is unavailable during...

- 18-11-2026
What Is MRO Inventory? Management & Optimization Guide
Most plants that struggle with MRO inventory face two problems at once: cash tied up in parts that...
- 17-11-2026
Mean Time Between Failures (MTBF): Formula and Benchmarks
Mean time between failures (MTBF) tells you how long a piece of equipment typically runs before it...