
What Is Schedule Compliance in Maintenance?
Maintenance schedule compliance is the percentage of scheduled maintenance work that crews complete in the week it was planned for. It is measured against the schedule as it was locked at the start of that week. It can be counted in work orders or in hours. The measure is also called compliance to schedule, and SAP Resource Scheduling reports it as schedule attainment.
It checks the handoff from planning to execution, and the number tells a maintenance manager the following:
- Did the work committed for that week happen?
- Was the schedule realistic?
- Were the jobs truly ready, with parts, permits and access in place before the technicians arrived?
- Did unplanned work displace planned jobs?
However, it does not show whether the scheduled work was the right work, or how much of all maintenance was planned. A lightly loaded week can produce a high score while leaving crew hours unused. A count-based score can also penalize a team when a few large jobs slip. Plants should report the method and loading beside the result.
Schedule Compliance Formula and How to Calculate It
In simple terms, schedule compliance is the share of scheduled work that was actually completed as planned.
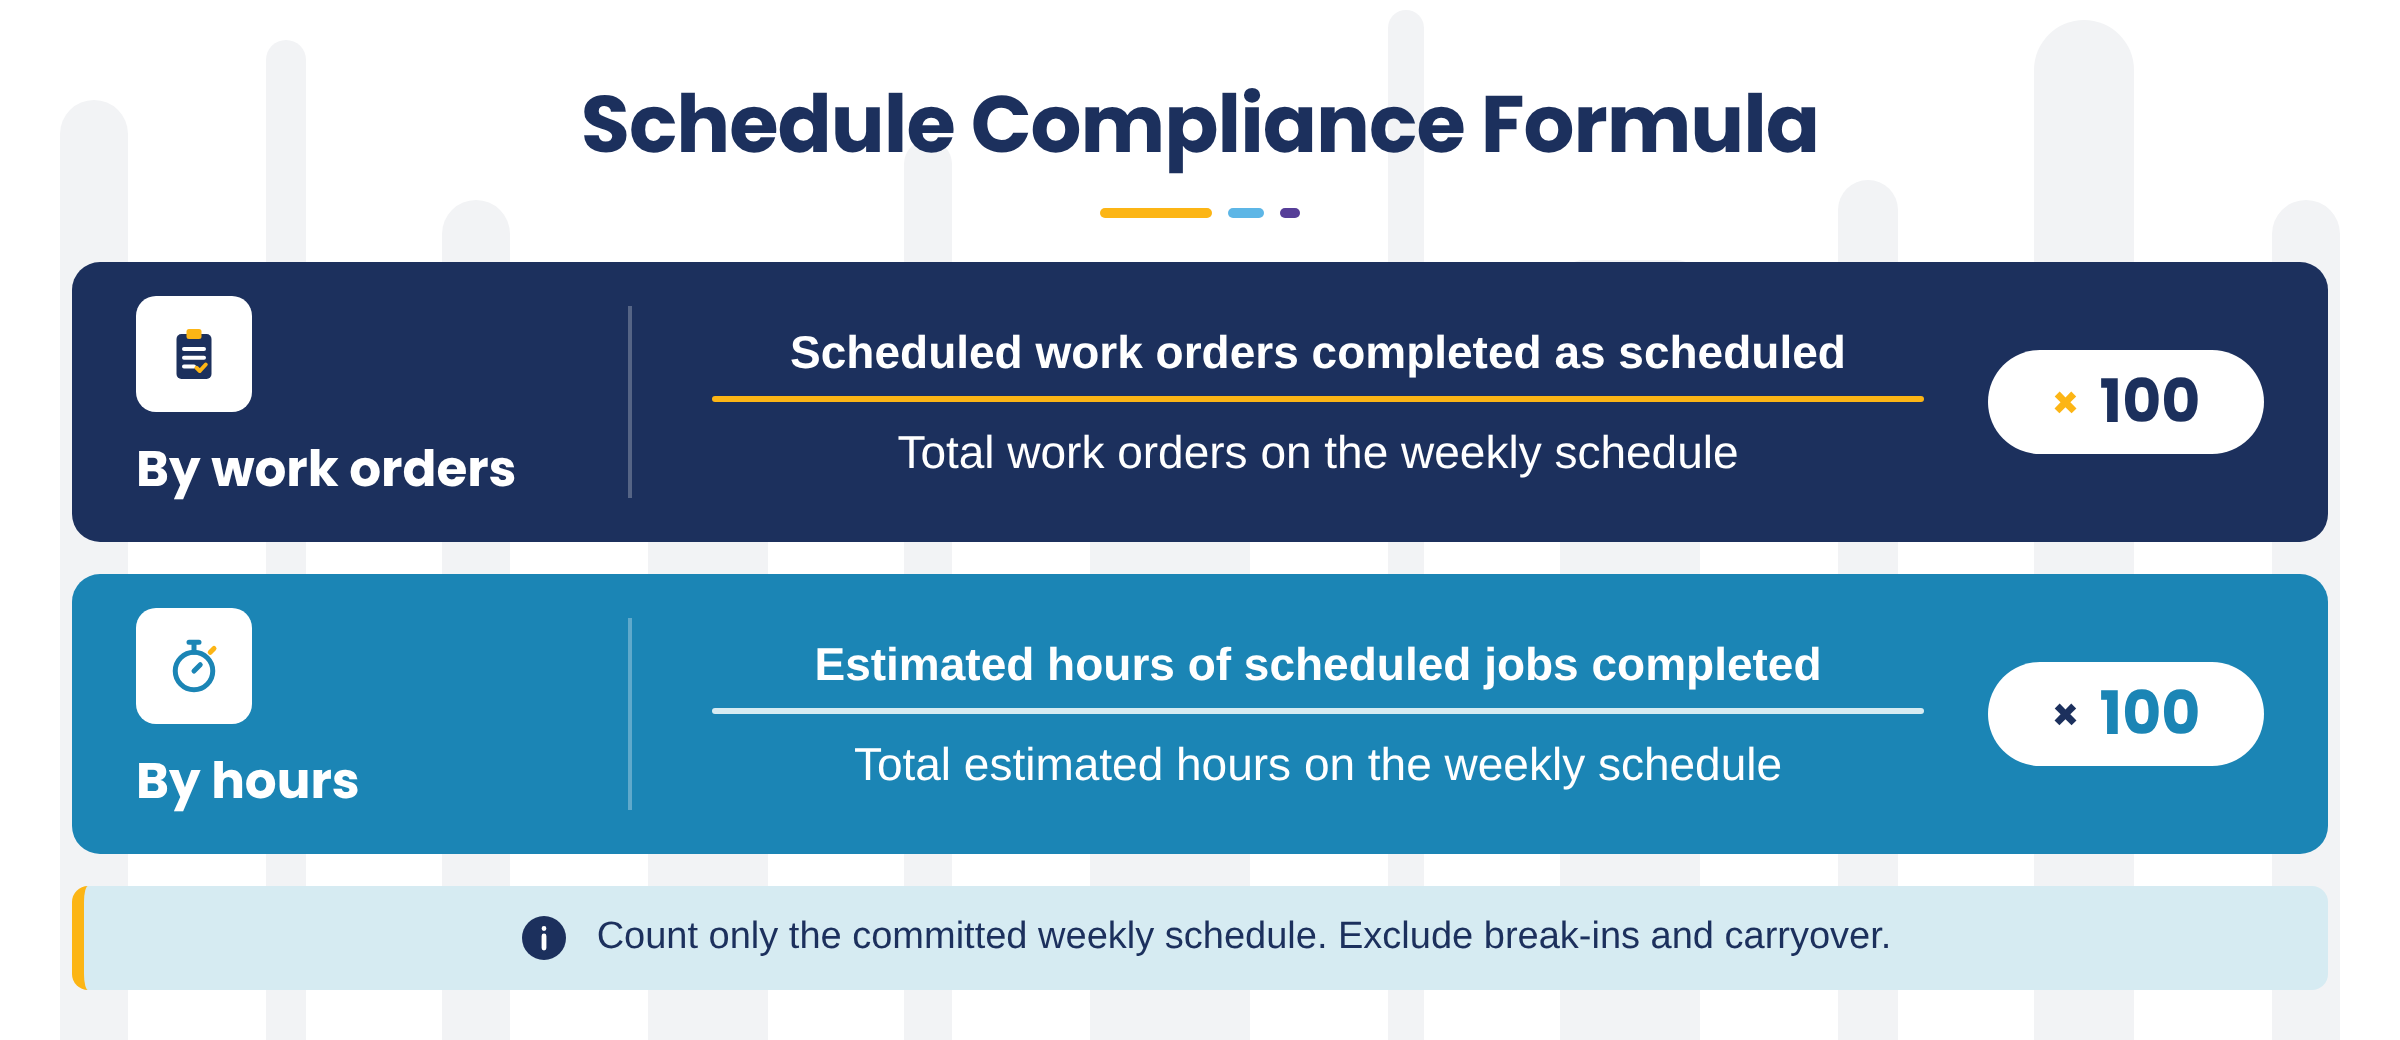
| Schedule compliance (%) = (Scheduled work completed as scheduled ÷ Total scheduled work) × 100 |
Scheduled work means the jobs on the week's committed schedule, counted in work orders or hours. The counting rules below matter as much as the formula itself. SMRP defines two versions of this formula, one counted in work orders and one in hours. State which version you report and keep it the same from week to week.
Schedule Compliance by Work Orders
Divide the number of scheduled work orders completed as planned by the total number of work orders on the weekly schedule, then multiply by 100.
| Schedule Compliance by Work Orders (%) = (Scheduled work orders completed as planned ÷ Total work orders on the weekly schedule) × 100 |
Use this count-based view when jobs are reasonably comparable. Count only work orders on the committed schedule that were completed within the period. Break-ins and carryover work do not offset missed scheduled jobs.
Schedule Compliance by Hours
Add up the estimated hours of every scheduled job that was completed, divide by the total estimated hours on the weekly schedule, then multiply by 100.
| Schedule compliance (%) = (Estimated hours of scheduled jobs completed as scheduled ÷ Total estimated hours on the weekly schedule) × 100 |
The hours version uses each completed job's planned estimate, not the hours actually booked. A job that ran over still counts at its estimate, because the metric measures whether committed work got done.
Work order counts are simple and work well when most jobs are small and similar. Hours give a truer picture for crews that mix overhauls with routine work. The SMRP Best Practices, Metrics and Guidelines accept either basis. The rule is to state the basis beside the number and keep it the same from week to week.
What Counts Toward Schedule Compliance and What Does Not
Only jobs on the frozen schedule count toward the work order numerator, and only hours on those jobs count toward the hours numerator.
| Work type or event | Count in work-order compliance? | Count in hours version? | How to handle it |
|---|---|---|---|
| Job on the committed schedule and completed within the period | Yes | Yes, at its estimated hours | Count it in the numerator and denominator. |
| Break-in or emergency work added after the freeze | No | No | Track separately by hours and cause; do not offset missed work. |
| Carryover from the previous week | Only if it is on this week's schedule | Only if it is on this week's schedule | If it was not included in this week's snapshot, record it as completed work outside this schedule. |
| Job pulled forward from next week | No | No | Record separately; it does not offset a miss. |
| Job started but not completed by period end | No, not as a completed work order | No; its estimated hours stay in the denominator | Keep it in the denominator as incomplete. |
| Work finished on time but confirmed late | Set a short, fixed cut-off, such as noon on the first day of the next week | Same cut-off | Apply the same cut-off every week. |
| Follow-up work discovered during a scheduled job | No, unless separately planned before the freeze | No, unless separately planned before the freeze | Create a new work order for planning. |
| Job cancelled before execution with approval | Apply a documented plant rule | Apply the same plant rule | Define whether it leaves the denominator, then apply consistently. |
Whatever rules your plant chooses, document them beside the result and retain the original schedule for review.
Stop Scheduling Work That Is Not Ready.
Learn the planning steps that confirm parts, permits and isolations before the week locks.
Schedule Compliance Calculation Examples
Consider a maintenance crew with 64 work orders on its weekly schedule. The work is estimated at 1,168 hours: one 160-hour heat-exchanger bundle pull and 63 routine jobs estimated at 16 hours each. The crew completes 54 work orders as scheduled. The bundle pull and nine routine jobs were not completed, which leaves 304 estimated hours undone (160 + 9 × 16). Six break-in jobs and four carryover jobs that were not on this week's schedule are also completed.
| Method | Numerator | Denominator | Calculation | Result |
|---|---|---|---|---|
| By work orders | 54 work orders | 64 work orders | 54 ÷ 64 × 100 | 84.4% |
| By hours | 864 hours (1,168 minus 304 slipped) | 1,168 hours | 864 ÷ 1,168 × 100 | 74.0% |
| Counting everything completed (incorrect) | 64 jobs (54 + 6 break-ins + 4 carryover) | 64 work orders | 64 ÷ 64 × 100 | 100% |
The work order count looks healthy because the largest job is only one of 64. The hours view shows that about a quarter of the committed hours never happened. The third row is the figure that often ends up in the weekly maintenance report to the plant manager. It reads 100%, yet 10 committed jobs and 304 committed hours were never done. These figures are illustrative, so test the method on a real week from your own crew.
Does the 10% Rule Apply to Schedule Compliance?
No. The 10% rule is a common tolerance for preventive maintenance due dates, where a PM counts as on time if it is done within 10% of its interval. Under that convention, a 30-day PM finished on day 33 is on time, while one finished on day 34 is late. SMRP's PM compliance guidance lets a plant choose its grace window, provided the window is stated beside the number.
However, the window applies to the PM interval, not the weekly schedule. Plants should set the next due date from the original schedule, not from the late finish. Otherwise, a 30-day vibration route on boiler feed pumps that finishes three days late every cycle becomes a 33-day route, and the pumps lose about one inspection a year.
The 10% window never applies to weekly schedule compliance. A PM moved to next week does not count toward this week's committed schedule, even if it is still inside its due window.
How SAP and IBM Maximo Calculate Schedule Compliance
SAP and Maximo do not necessarily use identical formulas. Confirm the module, period, numerator and denominator before comparing reports.
SAP S/4HANA Resource Scheduling calls its measure schedule attainment. It compares planned work completed as planned with work planned at schedule freeze, using planned hours rather than actual duration. Final confirmations affect the reported period.
IBM Maximo compares actual hours of work planned at the start of the period with total planned hours. The cycle can be weekly or otherwise configured; verify the formula in the version your site runs.
Without a system report, save a copy of the schedule when it is locked and compare it with work-order completion and time records at period end. Record break-ins and rescheduling reasons. Late confirmations can make a report reflect data-entry lag rather than execution.
What Is a Good Schedule Compliance Percentage?
SMRP lists greater than 90% as the best-in-class target for schedule compliance. Innovapptive's published maintenance latency diagnostics report schedule compliance around 70% as commonly observed in the plants assessed and use above 85% as a healthy benchmark in that diagnostic context. The 85% figure is not a universal industry average, and the two figures should only be compared when the underlying formula, time period and loading basis align.
A result of 100% is a reason to look closer rather than a goal, because it often means the week was under-loaded or the counting rules were bent. Set a target only after several weeks of consistent measurement. Compare compliance with loading, break-in hours, ready backlog and reasons for misses. Fix inconsistent counting before judging performance.
Schedule Compliance Benchmarks From Firefighting to Best Practice
These are the bands most often cited across the industry. Only the 90% target has a formal source, so treat the lower bands as directional guidance.
| Weekly compliance | What it usually means | What to check first |
|---|---|---|
| 100% | The week was under-loaded, or break-ins and carryover were counted | Schedule loading and the counting rules |
| 90 to 99% | SMRP best-practice range | That the week was loaded to the crew's forecast hours |
| 85 to 89% | Innovapptive's healthy benchmark on a fully loaded week | That the freeze is protected and estimates stay honest |
| 70 to 84% | The week partly holds | Readiness gaps and the volume of break-in work |
| Below 70% | Reactive work is setting the agenda | Whether unready jobs reach the schedule and whether operations releases equipment on time |
A 100% result is not automatically wrong. Investigate it when it recurs alongside low schedule loading, missing break-in records or counting rules that change from week to week.
Why 85% Is the Benchmark, Not 90% or 100%
Innovapptive's diagnostics in chemicals, refining, mining and consumer goods plants commonly observe schedule compliance around 70%. These are observations from Innovapptive assessments, published in its analysis of maintenance latency, not industry averages. From that starting point, 85% on a consistently loaded week is a practical milestone, while SMRP's 90% remains the best-in-class goal.
The milestone is tied to a loaded week for a reason. Doc Palmer, author of the Maintenance Planning and Scheduling Handbook, recommends scheduling a crew's full forecast hours. He argues that a fully loaded crew completes more total work, even with compliance below 90%, than a lightly loaded crew that reports a higher percentage.
To set your own target, measure four to six weeks first, then raise the target in stages.
Read Schedule Compliance Against Schedule Loading
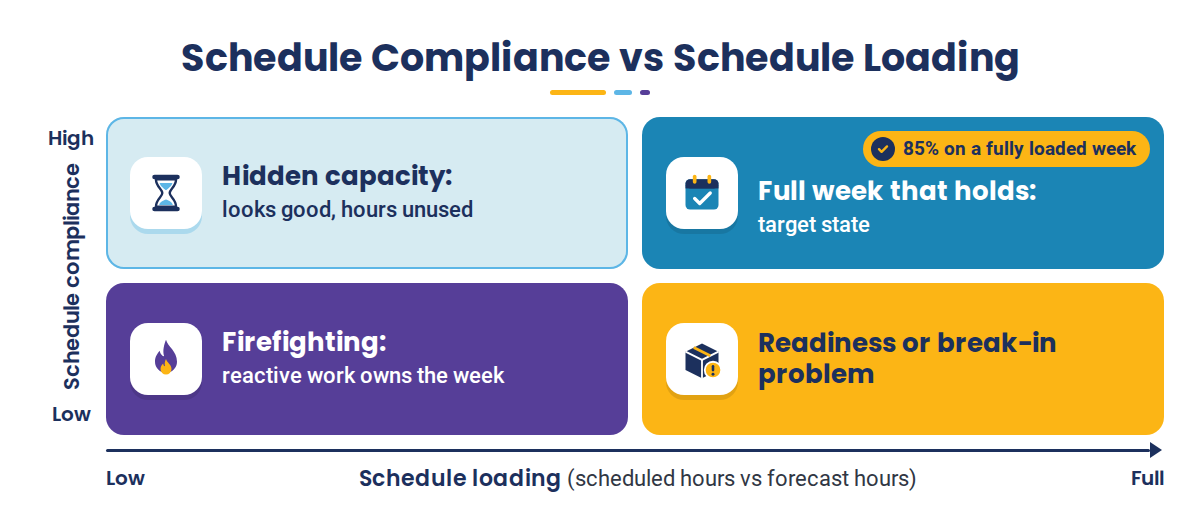
Schedule loading is scheduled hours divided by the hours available to schedule. Report it beside every compliance figure and compare it with your plant's loading policy. Some plants schedule all forecast hours, while others reserve a buffer for break-ins based on their measured break-in rate. Either approach works, as long as the buffer is set from the break-in rate you have measured rather than a guess.
|
Loaded below policy |
Loaded to policy |
|
|---|---|---|
|
High compliance |
Hidden capacity. Less work was committed than the crew could do. |
Target state. The committed week was performed. |
|
Low compliance |
Firefighting. Reactive work is taking most of the crew's hours. |
Readiness or break-in problem. Start with the fixes in the next section. |
Where Does Your Committed Week Break Down?
The sample report shows how a two-day site review maps missed work to readiness, release and estimate gaps.
Why Schedule Compliance Is Low and How to Improve It
Low compliance is rarely fixed by asking technicians to work faster. Review why jobs slipped: parts, permits, equipment release, labor availability or unrealistic estimates are often the root cause.
A short weekly missed-work report makes those causes visible. Here is what one could look like for the crew in the earlier example, with each of the 10 missed jobs given a reason code and an owner.
| Reason code | Jobs missed | Estimated hours missed | Owner | Action before next week |
|---|---|---|---|---|
| Equipment not released | 1 | 160 | Operations lead | Agree a release window for the bundle pull at the freeze meeting. |
| Parts not ready | 4 | 64 | Planner and storeroom | Kit parts and confirm stock before the schedule is locked. |
| Permit or isolation not ready | 2 | 32 | Planner | Confirm the permit window and isolation list before the freeze. |
| Displaced by break-in work | 2 | 32 | Maintenance manager | Review the six break-ins against the break-in rules. |
| Estimate overrun | 1 | 16 | Planner | Update the job plan duration from recent actuals. |
| Total | 10 | 304 |
The report is illustrative. Over a few weeks, the same pattern shows which causes keep repeating and who needs to act on them. The table below pairs the most common causes with an improvement action.
| Common cause | What the crew experiences | Improvement action |
|---|---|---|
| Parts, permits or isolations not ready | The technician arrives but cannot start safely or productively. | Use a readiness gate before the freeze. Confirm material, permit, isolation and access status and assign an owner to every open item. |
| Inaccurate duration estimates | One job takes longer than planned and pushes later jobs off the schedule. | Compare estimates with recorded actuals from recent executions. Update job plans where there is a repeated variance. |
| Schedule changed after commitment | Jobs are added, removed or moved without a clear audit trail. | Set a freeze window. Require approval and a recorded reason for schedule changes after the freeze. |
| Emergency or break-in work displaces planned work | Crews are redirected to failures, urgent production issues or safety risks. | Define what qualifies as a break-in, record the hours and cause, and use the trend to set a realistic allowance. |
| Operations does not release equipment | Maintenance resources are ready, but production continues to run the asset. | Agree on equipment release windows before the week starts. Assign an operations owner and group jobs into a single downtime window when practical. |
| Too much low-value preventive work | Recurring tasks consume capacity without finding actionable defects. | Review task history with reliability engineering. Revise or retire low-value tasks only with appropriate technical and safety approval. |
| Labor availability changes | Leave, training, callouts or skill gaps reduce the planned capacity. | Build the schedule from forecast available hours by craft and skill, not from headcount alone. |
1. Confirm Parts, Permits and Isolations Before the Schedule Locks
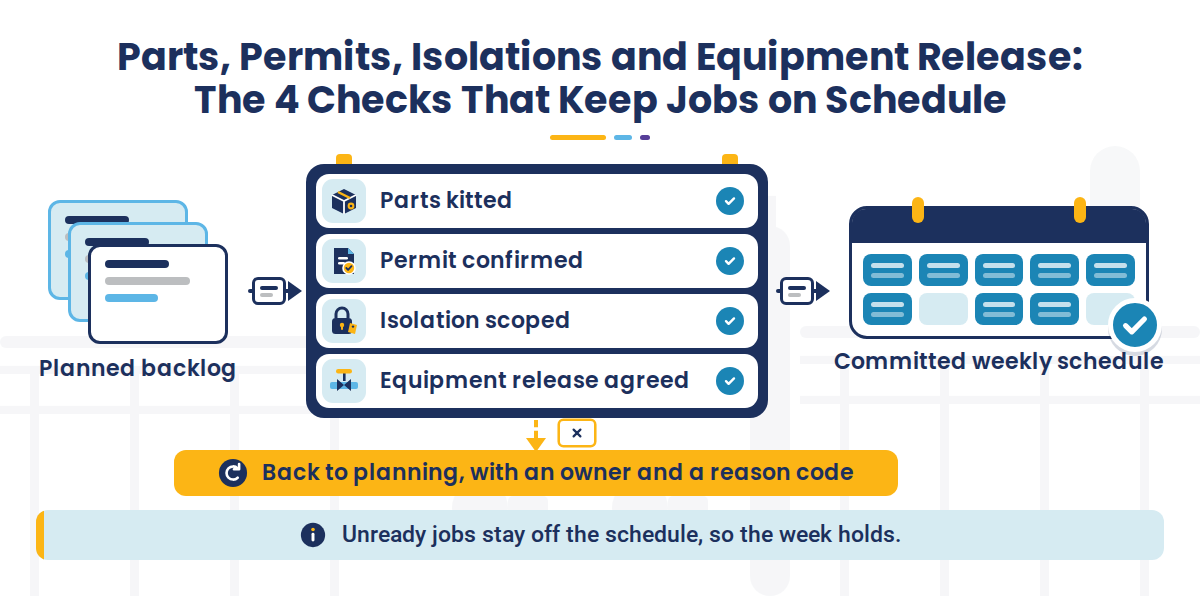
A job should enter the week's schedule only when four things are confirmed:
- Parts are reserved, staged and gathered into a job kit, a step known as kitting.
- The permit can be issued in the planned window. An electronic permit to work makes that status visible before the week locks.
- Isolation points are scoped under the plant's lockout/tagout procedure, in line with OSHA's lockout/tagout standard (29 CFR 1910.147).
- Access needs such as scaffolding and cranes are booked.
The planner confirms readiness, and the scheduler turns away jobs that are not ready.
2. Estimate Job Hours From Actuals, Not Standard Times
An estimate that runs short pushes later jobs off the week. Size durations from the actual hours of recent executions of the same job plan, and update the plan at closeout. A heat exchanger cleaning planned at 12 hours that took 18 hours on each of its last four runs should be planned at 18. A monthly comparison of actual and planned hours also catches padded estimates.
3. Load the Week to Available Hours and Freeze It
Build the week from each craft's available hours under your loading policy, then freeze it before the week starts. Many plants hold a short freeze meeting where operations, the storeroom and the crew supervisor sign off on next week's jobs. After the freeze, a job leaves the schedule only with a named approver and a recorded reason, and anything added is counted as a break-in.
4. Control Break-In Work With Clear Rules and Reason Codes
Some break-in work cannot be avoided, but all of it can be managed with four rules:
- Define what qualifies: a safety risk, an environmental risk or production loss on a critical asset.
- Postpone a job that has not started instead of stopping one already in progress.
- Record every break-in with its hours and a reason code.
- Set next week's break-in allowance from the rate you actually measured.
Useful reason codes for missed jobs and hours include emergency failure, parts not ready, permit or isolation not ready and equipment not released. Add labor not available, rework or material quality, and estimate overrun. In plants that run around the clock, the shift handover should carry these codes.
5. Agree Equipment Release Windows With Operations
A job is not ready until operations agrees when the asset comes off line. Agree release windows at the freeze meeting, each with a named owner in operations. On bottleneck assets, bundle jobs into one window so the line stops once. A concentrator conveyor that production will not stop three times may be released for one four-hour window that covers all three jobs.
6. Retire PM Tasks That Add Hours but Find Nothing
Review PM tasks whose recent executions found no defect, that duplicate another task or that could move to operator rounds. With sign-off from reliability engineering, retire them, merge them, extend the interval or reassign them, but never on safety-critical or regulatory tasks. Deciding which tasks belong in a preventive maintenance program in the first place starts with failure modes and asset criticality.
The Fixes Above Start on the Front Line.
Reason codes, readiness checks and actual hours all come from the field. Read how an execution platform captures them
Schedule Compliance vs Schedule Attainment and Other Maintenance KPIs
Schedule compliance answers one question: was the committed week performed? The related metrics explain why it was or was not, and each can be distorted in its own way.
| Metric | Question it answers | How it is calculated | How it gets distorted |
|---|---|---|---|
| Schedule compliance | Was the committed week performed? | Work orders performed as scheduled ÷ work orders on the schedule × 100, or the SMRP hours version | Counting break-ins or carryover, or under-loading the week |
| Schedule attainment (SAP) | Were scheduled operations finally confirmed in the period? | Work completed as planned ÷ work planned for the schedule period | Late or partial confirmations |
| PM compliance | Were preventive tasks done within their due window? | PMs completed within window ÷ PMs due × 100 | Moving due dates before tasks fall overdue |
| Planned maintenance percentage | How much maintenance work was planned? | Planned maintenance hours ÷ total maintenance hours × 100 | Labeling reactive jobs as planned |
| Wrench time | How much paid time goes to hands-on work? | Hands-on time ÷ paid time, from work sampling | Sampling only on quiet days |
| Ready backlog | How much ready work is waiting? | Hours of ready work ÷ weekly crew hours, in crew-weeks | Marking jobs ready before parts arrive |
Read these metrics together. If compliance rises while the ready backlog shrinks, planners are running out of ready jobs and next month's schedule will be hard to fill. A healthy maintenance backlog of ready work keeps high compliance sustainable.
Schedule Compliance vs Schedule Attainment
In maintenance, schedule attainment is SAP's name for a measure of the locked schedule based on finally confirmed operations, close to the work order version of schedule compliance. In manufacturing production, the same term means the share of planned output or orders completed on time. Keep the two on separate lines of the plant scorecard.
Schedule Compliance vs PM Compliance
PM compliance asks whether each preventive task was done within its due window. Schedule compliance asks whether the committed week was performed across preventive, corrective and project work. A site can report 95% PM compliance and 72% schedule compliance in the same month when PMs get done but corrective jobs keep slipping. PM compliance can also look strong when due dates are moved before tasks fall overdue, which makes schedule compliance the better check on committed work.
How Low Schedule Compliance Raises Overtime, Contractor Spend and Downtime
Missed scheduled work does not disappear. Depending on the job and the next available window, it adds to the backlog, is bought back later through overtime or contractors, or extends an outage.
1. Labor and overtime cost: Recovered work is often done on overtime. Overtime is commonly paid at around 1.5 times the base rate, although the premium varies by site, shift pattern and labor agreement. Plants working to reduce overtime in manufacturing usually start with the weekly schedule.
2. Outside contractor spend: As backlog grows, more work goes to contractors, whose hours usually cost more.
3. Lost production revenue: When PMs and repairs on bottleneck assets slip, unplanned stops become more likely and planned outages can run longer. Protecting those hours is one of the most direct ways to improve throughput in maintenance.
National Institute of Standards and Technology (NIST) found that manufacturers in the highest quartile for reliance on reactive maintenance were associated with 3.3 times more downtime and 16 times more defects than those in the lowest quartile. This is an association with reactive maintenance, not proof that a specific compliance percentage causes those outcomes.
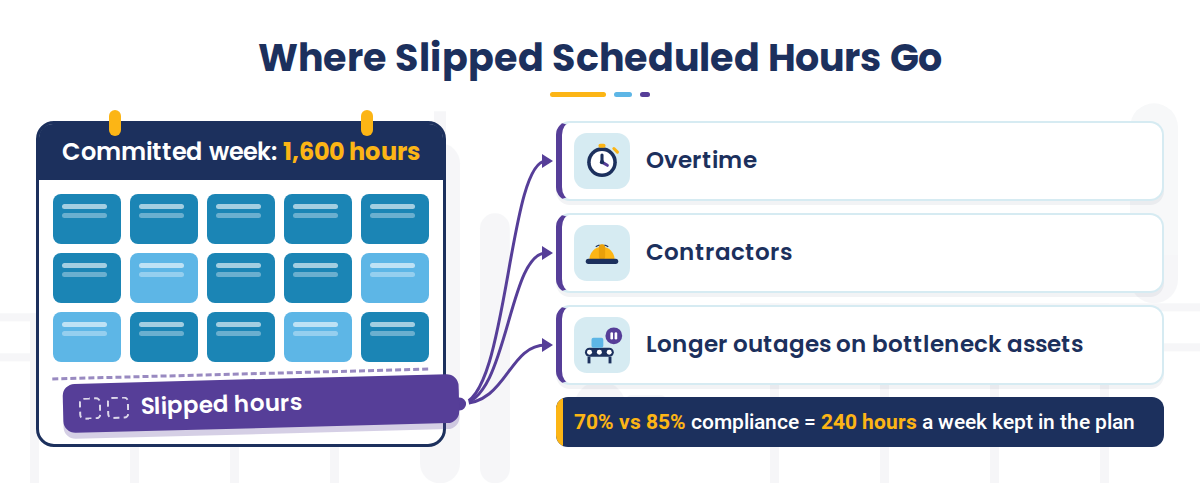
Take a crew with 1,600 hours available to schedule each week and a schedule loaded to all of them. Measured with the SMRP hours formula, moving from 70% to 85% compliance means 240 more hours a week spent on scheduled work. If half of those hours would otherwise be bought back later, the plant avoids buying back 120 hours a week.
| Assumption or calculation | Value |
|---|---|
| Hours available to schedule each week | 1,600 hours |
| Hours performed on scheduled work at 70% compliance | 1,120 hours per week |
| Hours performed on scheduled work at 85% compliance | 1,360 hours per week |
| Difference between the two results | 240 hours per week |
| Assumed share of the difference that otherwise would be recovered later | 50%, or 120 hours per week |
| Overtime scenario: the 120 hours are worked as overtime. The overtime rate is $135 an hour, based on an assumed $90 base loaded hourly rate multiplied by an assumed 1.5 overtime premium. | $16,200 per week (120 × $135); $777,600 over 48 weeks ($16,200 × 48) |
| Contractor scenario: the 120 hours go to contractors at an assumed rate of $120 an hour. | $14,400 per week (120 × $120); $691,200 over 48 weeks ($14,400 × 48) |
The overtime and contractor values are alternatives, not additive. The model assumes 120 hours are repurchased each week for 48 weeks. Replace every assumption with site data; backlog and outage effects are not included.
What Is Your Schedule Compliance Gap Costing?
In a free two-day Margin Walkthrough at your site, Innovapptive traces where committed work slips, prices the overtime and contractor hours behind it and ranks what to fix first
How Innovapptive Helps Maintenance Teams Improve Schedule Compliance
Innovapptive is an industrial execution platform that works on top of the ERP or EAM a plant already runs, such as SAP PM, IBM Maximo or Oracle. That system stays the system of record, and Innovapptive does not replace it. Innovapptive's Maintenance Planning and Scheduling Software, iMPS, is built around the same causes and fixes covered in this guide:
- Readiness before the freeze: Parts, permits and isolations are confirmed before the schedule locks, so unready jobs stay off the committed week.
- Estimates from real work: Job durations are sized from execution history instead of standard times.
- A freeze that holds: Work is bundled by downtime window, and any change to the locked schedule needs approval and a recorded reason.
- Break-ins on record: Break-ins and the reason behind every schedule change are captured as they happen, so the weekly review starts from data.
- Live visibility: Schedule compliance, wrench time and downtime are visible in real time instead of being rebuilt from spreadsheets at month end.
This focus on getting work ready before it is scheduled is part of why Frost & Sullivan named Innovapptive its 2026 Company of the Year in Global Augmented Connected Worker Platforms.
At Indorama Ventures' Port Neches, Texas site, Innovapptive's Connected Worker Platform raised parts availability from 55% to 95% and cut overtime in half. The site realized $19M in EBITDA savings in 2025. These results come from the full platform deployment, not scheduling alone, and the Indorama Ventures case study covers them in detail.
Find Out Which of Next Week's Jobs Are Not Ready Yet
Bring a real schedule from your SAP PM or Maximo system. We will show you how Innovapptive maintenance planning and scheduling software confirms parts, permits and isolations before the week locks, so the jobs you commit to are jobs your crews can finish.

Unlock Margins Hidden in your Maintenance
Watch how leading manufacturers improve OEE, increase PM compliance, and reduce downtime through connected execution.

- 30-10-2026
Schedule Compliance: Formula, the 85% Benchmark and Fixes
Schedule compliance measures how much of a committed maintenance schedule gets completed as...

- 27-10-2026
Best Industrial Inspection Software: 11 Platforms Compared
Inspection software encompasses a broad market with its functionality varying widely. Repair shops...

- 23-10-2026
Maintenance Planning and Scheduling: The Ultimate Guide
A mechanical crew reaches a boiler feed water pump at 7 a.m. to change a bearing, then waits three...