
Mean time between failures (MTBF) tells you how long a piece of equipment typically runs before it breaks down again. You calculate it by dividing the hours the equipment ran by the number of times it failed.
The number becomes more useful when you read it alongside the asset's role in production. In a plant, a failed pump may be manageable if a standby unit takes over. A failure on the only compressor feeding a production unit can stop the line.
This guide covers the MTBF formula, the data behind it, useful benchmarks, and ways to improve reliability on assets that affect plant output.
What Is MTBF in Maintenance?
Mean time between failures (MTBF) in maintenance is the average operating time a repairable asset runs between one unplanned failure and the next. It is usually measured in hours and helps teams understand how often a machine breaks down while it is in use.
You may also see it written as the mean time between failure. It is one of the standard maintenance metrics defined by the Society for Maintenance and Reliability Professionals (SMRP) and a core measure of asset reliability.
Four things are worth knowing before you use the number:
- It applies to repairable assets: Equipment that is fixed and returned to service has an MTBF. Parts that are replaced after they fail, such as a bearing or a fuse, use mean time to failure (MTTF) instead.
- It is counted in operating hours: A machine that runs for one shift each day should not be compared using the same calendar-hour assumption as a machine that runs continuously.
- Higher is better: A higher MTBF means fewer failures for the same hours run. A falling MTBF is an early sign of a reliability problem.
- It is an average, not a prediction: An MTBF of 700 hours does not mean the next failure will arrive at hour 700 after the last one.
MTBF does not explain why an asset failed, how long a repair took, or how much production was lost. It should be read alongside MTTR, availability, repeat failures, and downtime cost.
MTBF Formula and How to Calculate It
The MTBF formula divides an asset's operating hours by the number of qualifying failures recorded during the same period. Use the same asset and the same observation window for both numbers.
| MTBF = Total operating time ÷ Number of failures |
For example, a machine that ran for 2,000 hours and failed 4 times has an MTBF of 2,000 ÷ 4 = 500 hours. The calculation takes four steps:
|
Step |
What to do |
How to do it |
|---|---|---|
|
Step 1 |
Choose the equipment and the time period |
Pick one machine, or a group of identical machines doing the same job. Choose a period long enough to include several failures: 12 months for equipment that fails a few times a year, a month or a quarter for equipment that fails often. |
|
Step 2 |
Add up the operating hours |
Count only the hours the equipment was actually running in that period. |
|
Step 3 |
Count the failures |
Count the unplanned failures that maintenance had to repair. Leave out planned shutdowns and scheduled maintenance. |
|
Step 4 |
Divide |
Divide the operating hours by the number of failures. The result is the MTBF in hours. |
Most wrong MTBF figures come from counting the wrong events as failures or the wrong hours as operating time.
What Counts as a Failure in MTBF
Define a failure before you calculate MTBF. A practical starting point is an unplanned loss of the function the process needs from the asset, followed by corrective work. Use the same rule across reporting periods and sites.
|
Event |
Count it? |
How to record it |
|---|---|---|
|
Unplanned breakdown repaired by maintenance |
Yes |
This is the event MTBF is designed to measure. Record the event against the asset and capture the problem, cause, and repair details. |
|
Trip that operations resets with no repair |
Decide once and apply everywhere |
Decide whether these events meet the failure definition. If excluded, track them separately so they remain visible. |
|
Defect found on rounds or during a PM and fixed before the asset stopped |
No |
Record it as an early finding or condition issue. It may help prevent a later failure. |
|
Failure within 30 days of a repair on the same asset |
Yes |
Count every qualifying repeat breakdown. Flag repeat events so the team can check whether the original cause was removed or the repair introduced another problem. |
|
Planned shutdown or PM outage |
No |
Keep planned work separate from unplanned failures. |
|
Stop caused by no feed, a process upset, or a site power loss |
No |
Record the actual cause of the interruption. |
What Counts as Operating Time
Operating time is the number of hours the equipment was actually running. It is different from calendar time, and the difference can be large.
Take a bagging machine that runs one 8-hour shift a day. In a 30-day month it runs 240 hours, although the month has 720 hours. If it failed twice, its MTBF is 240 ÷ 2 = 120 hours. Calendar hours would give 720 ÷ 2 = 360 hours and make the machine look three times more reliable than it is.
A few simple rules keep the count accurate:
- Leave out planned shutdowns, scheduled maintenance, and the time spent on repairs.
- Leave out idle and standby time. A spare unit should be credited only with the hours it actually ran.
- For equipment that wears with use, count cycles instead of hours, such as strokes for a press or batches for a mixer.
- If run hours are not available, calendar time will overstate MTBF on assets that run only part of the time. Label that result as calendar-based.
The most important rule is to take operating hours from one consistent source every time. That can be a run-hour meter, the plant historian (the system that stores process data), or the production log.
How to Calculate MTBF in SAP PM and IBM Maximo
In SAP PM and IBM Maximo, MTBF reports rely on the quality of notifications and work orders. Each event should be linked to the correct equipment or functional location, classified consistently, and recorded with accurate dates and failure details. Report logic varies by system configuration.
An SAP PM report may miss a breakdown if the notification is not flagged correctly or its malfunction details are incomplete. In Maximo, missing problem, cause, or remedy codes can make repeat failures harder to analyze. In both systems, the report is only as reliable as the records behind it.
Capture failure details while the technician is at the asset rather than reconstructing them later. ISO 14224 provides a common data framework for the petroleum, petrochemical, and natural gas industries, covering equipment, failure, and maintenance information.
Find the Margin Your Maintenance Records Are Hiding
In two days on site, Innovapptive’s value engineers compare your SAP or Maximo data with how work gets done. Within four weeks you have a business case your CFO can sign.
MTBF Calculation Examples From a Process Plant
The two examples below use an illustrative polymer plant. The first calculates MTBF for a single machine. The second shows what an average across several machines can hide.
Single-Asset Example: One Extruder Over 12 Months
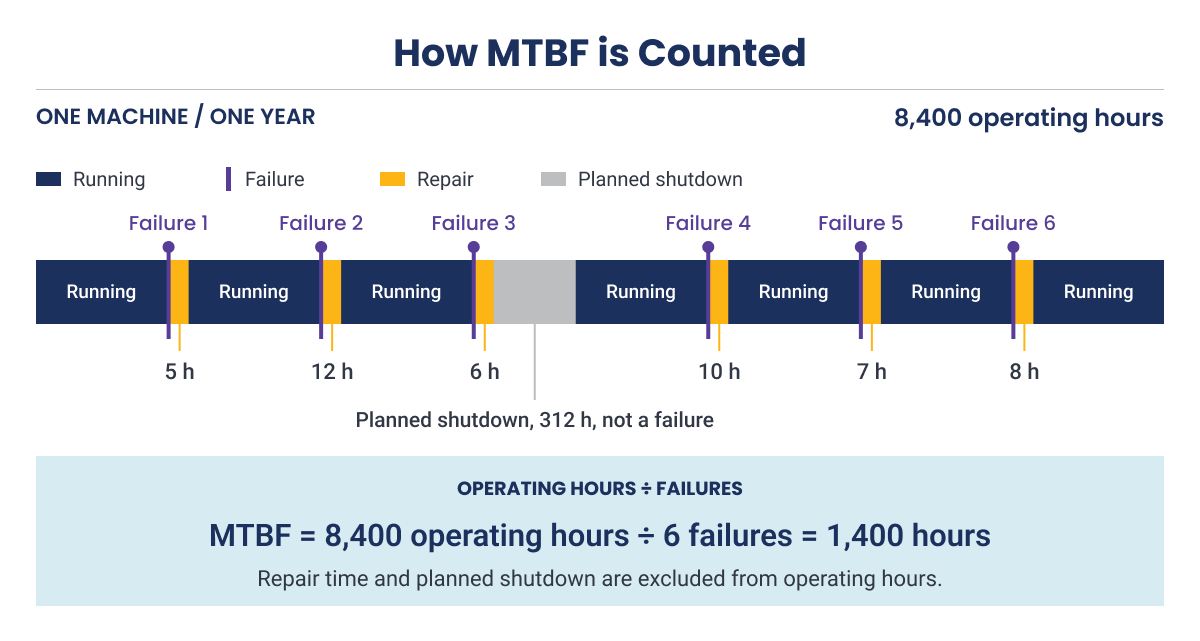
The plant has one extruder, and every ton of product passes through it. This is its record for the past 12 months.
| Record | Value |
|---|---|
| Total hours in the year | 8,760 |
| Planned annual shutdown | 312 hours (13 days) |
| Unplanned failures | 6 |
| Time spent on repairs | 5 + 12 + 6 + 10 + 7 + 8 = 48 hours |
|
Operating hours = 8,760 - 312 - 48 = 8,400 MTBF = 8,400 ÷ 6 = 1,400 hours |
On average, the extruder ran 1,400 hours, or about 58 days, between failures. Two common shortcuts would have produced a different answer from the same records:
|
Shortcut |
MTBF Result |
Effect |
|---|---|---|
|
Using all 8,760 calendar hours |
8,760 ÷ 6 = 1,460 hours |
Overstated. The extruder looks more reliable than it is |
|
Counting the planned shutdown as a seventh failure |
8,400 ÷ 7 = 1,200 hours |
Understated. The extruder looks less reliable than it is |
Fleet Example: Six Air Compressors in the Same Plant
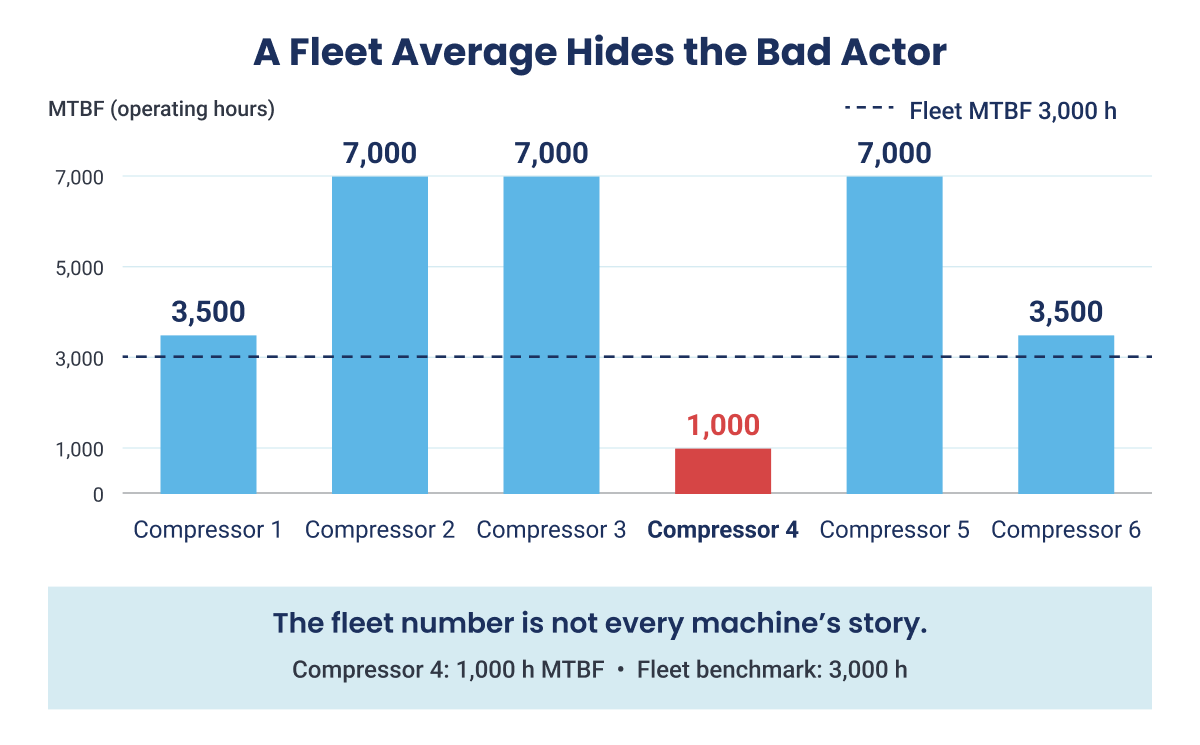
The same plant has six identical air compressors. Each one ran about 7,000 hours in the year, which is 42,000 hours in total. Together they failed 14 times.
| Fleet MTBF = 42,000 ÷ 14 = 3,000 hours |
Taken alone, 3,000 hours suggests six compressors in similar condition. The record for each compressor shows something different.
|
Compressor |
Operating hours |
Failures |
MTBF |
|---|---|---|---|
|
1 |
7,000 |
2 |
3,500 hours |
|
2 |
7,000 |
1 |
7,000 hours |
|
3 |
7,000 |
1 |
7,000 hours |
|
4 |
7,000 |
7 |
1,000 hours |
|
5 |
7,000 |
1 |
7,000 hours |
|
6 |
7,000 |
2 |
3,500 hours |
Compressor 4 caused half of all the failures. The other five ran 35,000 hours with 7 failures, an MTBF of 5,000 hours. One machine is pulling the average down, and the average is hiding it. Maintenance teams often call a machine like this a bad actor.
The practical rule is to calculate MTBF for each machine first, and to use a fleet average only for identical machines doing the same job.
MTBF vs MTTR vs MTTF: What Each Metric Tells You
The three metrics sound alike, but each one answers a different question.
- MTBF (mean time between failures) is the average running time between breakdowns of equipment that gets repaired. It tells you how often the equipment fails.
- MTTR (mean time to repair) is the average time it takes to repair the equipment and get it running again after a breakdown. It tells you how long each failure keeps the equipment down.
- MTTF (mean time to failure) is the average time a part lasts before it fails. It is used for parts that are replaced instead of repaired, such as bearings, belts and fuses.
|
Metric |
What it tells you |
Used for |
Formula |
Better when |
Example |
|---|---|---|---|---|---|
|
MTBF |
Average operating time between failures |
Repairable assets |
Total operating hours ÷ number of failures |
Higher |
Extruder: 1,400 hours |
|
MTTR |
Average time spent repairing an asset after a failure |
Repairable assets, after a failure |
Total repair time ÷ number of repairs |
Lower |
Extruder: 48 ÷ 6 = 8 hours |
|
MTTF |
Average time an item operates before its first and only failure |
Non-repairable items |
Total operating hours ÷ number of parts that failed |
Higher |
Bearings, belts and fuses |
|
Availability |
Share of required time an asset is available to operate |
Repairable assets |
MTBF ÷ (MTBF + MTTR) |
Higher |
Extruder: 99.4% |
How MTBF and MTTR Combine Into Availability
Availability is the share of time a piece of equipment is able to run when you need it. It depends on how often the equipment fails (MTBF) and how long each repair takes (MTTR), which makes it the number behind equipment uptime.
| Availability = MTBF ÷ (MTBF + MTTR) |
For the extruder, that is 1,400 ÷ (1,400 + 8) = 99.4%. The formula counts repair time only. Time spent waiting for parts, permits or a safe isolation is not included, so the availability you see on the plant floor is usually lower than the calculated figure.
MTBF vs MTTR: Which One to Improve First
Both matter, and they fix different problems. Improving MTBF means fewer failures. Improving MTTR means shorter ones. Which comes first depends on how your equipment is failing.
|
What you see |
What it means |
Improve first |
|---|---|---|
|
The same equipment fails often, but each repair is quick |
The problem is how often it fails |
MTBF. Find and remove the cause of the repeat failures. |
|
Failures are rare, but each one takes days to fix |
The problem is how long the repair takes |
MTTR. Hold the critical spares, prepare the job plan and make sure the right skills are available. |
|
Failures are frequent and long, or the asset is the bottleneck |
Every lost hour is lost production |
Both. Start with whichever is losing more hours. |
A quick check is to multiply the two. An asset that fails 10 times a year for 2 hours loses 20 hours. An asset that fails twice a year for 36 hours loses 72 hours. The second asset has the better MTBF and the bigger problem, which is why MTBF should not be used alone to rank equipment.
MTBF vs MTTF: Repairable vs Replaceable Assets
Use MTBF for an asset that is repaired and returned to service. Use MTTF for an item that is replaced after it fails rather than repaired. For example, a pump that is restored after a breakdown can be tracked using MTBF. A replace-on-failure fuse can be tracked using MTTF. Choose the measure based on how the item is maintained.
Better MTBF Starts With Cleaner Failure Data
A practical blueprint for maintenance and reliability leaders, from structured master data and failure codes to planning, permits and frontline execution.
What Is a Good MTBF? Benchmarks and How to Read Them
There is no single good MTBF for every asset. Equipment type, operating conditions, load, and failure definitions differ. A useful benchmark compares similar assets and shows whether reliability is improving.
- Is it improving? An MTBF that rises from one year to the next is moving in the right direction, whatever the number.
- How does it compare with identical equipment doing the same job? A machine that sits well below its twins needs attention.
- Do failures cost less than preventing them would? If the next improvement would cost more than the failures it removes, the MTBF is high enough for that asset.
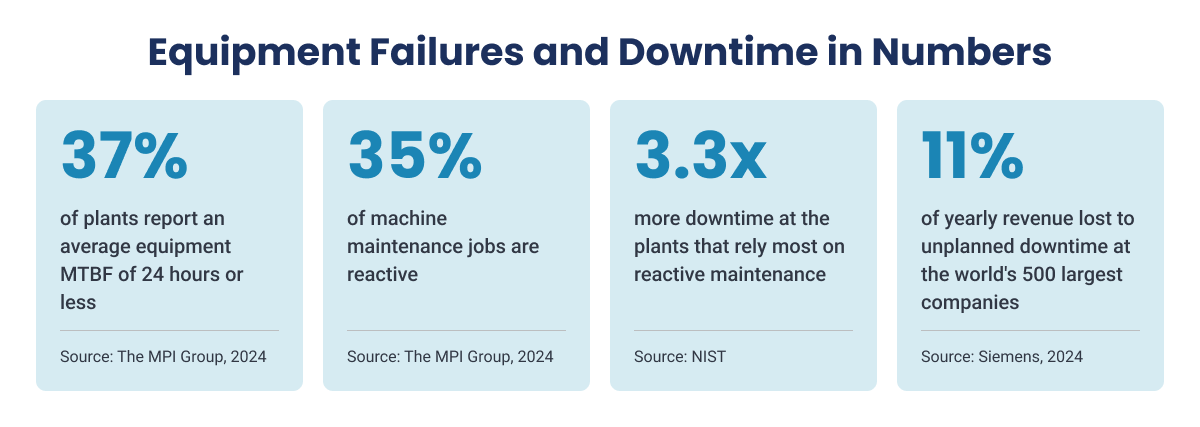
Published benchmarks still have a use, because they let you check that your figure is in a realistic range. However, they make poor targets, because you rarely know how a published figure was calculated. The MPI Group's 2024 Manufacturing Study found that 37% of 413 plants worldwide reported average equipment MTBF of 24 hours or less. It also found that 35% of machine maintenance jobs were reactive. These figures provide industry context, not a target for an individual pump or compressor. The public summary does not provide enough detail about equipment mix and failure-counting rules for a direct asset comparison.
Which MTBF Benchmarks to Trust
The closer a benchmark is to your own equipment and operating conditions, the more you can rely on it.
|
Benchmark |
What it helps you understand |
How to use it |
|---|---|---|
|
The asset's own rolling MTBF trend |
Whether that asset is failing more or less often |
Use the same failure definition and operating-hour basis over time. |
|
Similar assets in similar service |
Whether one unit is performing differently from its peers |
Compare duty, load, environment, maintenance strategy, and failure rules. |
|
Industry reliability databases, such as OREDA for oil and gas and IEEE 493 for electrical equipment |
How a class of equipment has performed across a defined population |
Check scope, equipment type, period, and how failures were counted before comparing. |
|
Manufacturer or design data |
Expected performance under stated design or test conditions |
Use it for design evaluation, not as a guaranteed field target. |
|
Broad manufacturing surveys |
How common reliability and maintenance challenges are |
Use for context, not as an operating target for a specific asset. |
Industry databases can add context, but they do not replace comparisons with assets doing the same job under similar conditions.
Use external research for context. Set targets using your own asset history and comparable equipment. Do not rely on a published range unless the equipment type, operating profile, period, and counting method are clear.
A Published Benchmark: Refinery Pump Fleets
A published figure is far more useful when it explains how it was calculated. The Pump User's Handbook by Heinz Bloch, a standard industry reference, describes a well-managed US refinery with 1,200 installed pumps and 156 pump repairs in a year. That is an MTBF of 1,200 ÷ 156 = 7.7 years. Look at how that figure was counted:
- It counts every installed pump, including spares that rarely run.
- It uses calendar years instead of operating hours.
- It counts every repair, from a small part to a major rebuild.
A plant that counts only running pumps, operating hours and major failures would get a very different number from the same equipment. The same source notes that pump life in chemical plants is generally believed to be 50% to 60% of refinery values. Compare your figure only with benchmarks counted the same way.
6.4 Days From Detecting a Problem to a Verified Fix
The FEE Benchmark Report shows how manufacturers measure the time from a detected problem to a verified fix. It covers where handoffs lose the most hours and how a faster response moves OEE and margin.
Why MTBF Matters Most on Bottleneck Assets
MTBF shows how often an asset fails. Its place in the process shows how much failure matters. A standby pump may fail without stopping production. A single compressor or feed conveyor may have no alternative, so its failure can stop the line.
Rank assets using failure frequency, production impact, downtime duration, and available redundancy, not MTBF alone. If you are not sure which asset limits your output, start with how to improve throughput in maintenance.
What One Failure on the Bottleneck Costs
Stay with the extruder. Each failure takes 8 hours to repair on average, plus another 4 hours to restart the line and get back to a good product. That is 12 hours of lost production for each failure. Assume each hour of production earns $20,000 after material and energy costs. The figures below are illustrative.
|
Today |
If MTBF doubles |
|
|---|---|---|
|
MTBF |
1,400 hours |
2,800 hours |
|
Failures per year |
6 |
3 |
|
Production lost per failure |
12 hours |
12 hours |
|
Production lost per year |
72 hours |
36 hours |
|
Value of lost production per year |
$1.44 million |
$720,000 |
Doubling the extruder's MTBF is worth $720,000 a year in recovered production, before any savings on overtime and emergency repairs. Doing the same for Compressor 4 would save a few repair bills.
A NIST study of US manufacturers found that the plants relying most on reactive maintenance had 3.3 times more downtime than those relying on it least. Each bottleneck breakdown also brings overtime, call-outs and delayed planned jobs, so fewer failures is a direct way to reduce maintenance costs.
How Indorama Ventures Realized $19 Million in Savings
Indorama Ventures, a $15.4 billion chemical producer, dealt with this problem at its Port Neches, Texas site. More than half of its maintenance work was reactive, and paper-based processes and manual SAP entry slowed every job down. The site moved work order execution, work instructions and operator rounds onto Innovapptive's Connected Worker Platform, running on its existing SAP system.
Planned work, measured as planned maintenance percentage, rose from 45% to 80% within 12 months. Parts availability rose from 55% to 95%. The maintenance backlog fell from 24 weeks to 10, and contractor headcount fell by 38%. The site realized $19 million in EBITDA savings in 2025.
These results show what changes when breakdowns stop setting the schedule: more work is planned, parts are ready and critical equipment gets attention before it fails.
Line MTBF: How Assets in Series Add Up
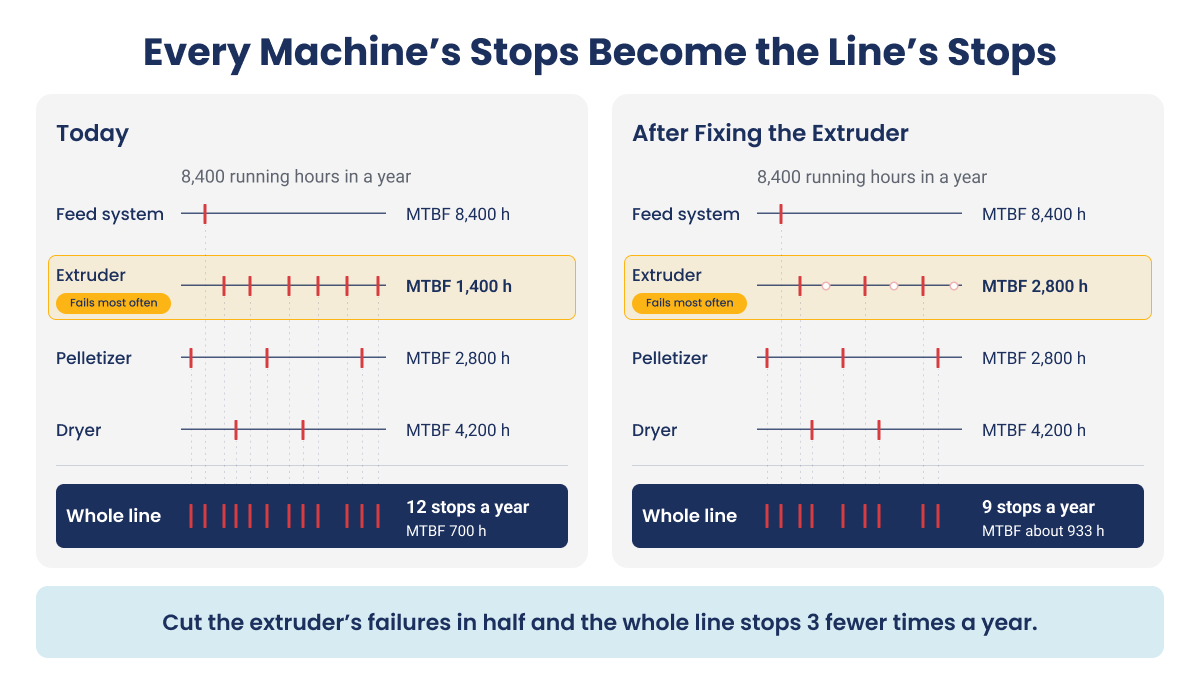
Most production lines are a chain of machines, and the line stops when any one of them fails. A line therefore fails as often as all of its machines put together.
Suppose the polymer line has four machines in a row and runs 8,400 hours a year.
|
Machine |
MTBF |
Failures per year |
|---|---|---|
|
Feed system |
8,400 hours |
1 |
|
Extruder |
1,400 hours |
6 |
|
Pelletizer |
2,800 hours |
3 |
|
Dryer |
4,200 hours |
2 |
|
Whole line |
700 hours |
12 |
The line stops 12 times a year, so its MTBF is 8,400 ÷ 12 = 700 hours. That is half the MTBF of its weakest machine. As a formula:
| 1 ÷ Line MTBF = (1 ÷ MTBF of machine 1) + (1 ÷ MTBF of machine 2), and so on for each machine |
The quickest way to raise the line MTBF is to fix the machine that fails most. Halving the extruder's failures from 6 to 3 takes the line from 12 stops a year to 9 and lifts its MTBF from 700 hours to about 933. Machines with an installed spare stay out of this sum, because a failure there does not stop the line.
How to Set an MTBF Target for Critical Equipment
Set the target using the asset's history and the consequence of its failure. A generic range cannot reflect your process, production rate, or standby capacity. Four steps get you there:
Step 1: Rank Your Equipment by Criticality
List your equipment by what happens when it fails: the effect on safety, on the environment and on production. Your bottleneck asset will be at or near the top for production.
Step 2: Work Out What One Failure Costs
Add the repair cost to the value of the production lost. For the extruder, that is 12 hours at $20,000, or $240,000 for each failure before repair costs.
Step 3: Price the Next Improvement
Identify the next change that would prevent failures and what it would cost. It might be a better seal, precise alignment, more frequent inspections or a design change.
Step 4: Set the Target Where the Improvement Still Pays
Compare the two. Suppose a $300,000 upgrade would cut the extruder's failures from 6 a year to 3. It saves $720,000 a year and pays for itself in five months, so the target becomes 2,800 hours.
Then test the next improvement the same way. If another $300,000 would prevent only one more failure a year, worth $240,000, the payback is longer than a year and may not be worth it. The target stops rising when improvements stop paying for themselves.
How Indorama Ventures Realized $19M in EBITDA Savings
See how Indorama moved to 80% planned work in 12 months and halved maintenance overtime, all on its existing SAP system.
How to Improve MTBF, Starting With the Bottleneck
MTBF improves when you remove the causes of failure on the equipment that matters most. The five steps below are in priority order, and together they are what a mean time between failure analysis should produce.
1. Rank Assets by Failure Cost, Not Failure Count
Work out what each asset's failures cost in a year: the number of failures multiplied by the cost of each one. Ranking by cost puts the bottleneck and the worst bad actors at the top. Ranking by failure count often puts minor equipment with frequent small stops there instead.
Concentrate on the top five to ten assets, leave the rest on their current plan, and review the list every quarter.
How to track it: total yearly failure cost of the top ten assets.
2. Find the Failure Mode Behind Repeat Failures
When an asset keeps failing, it is usually failing the same way each time. That repeating pattern is called a failure mode. A leaking seal, an overheating bearing and a tripping motor are typical examples.
Go through the last 12 months of failure records and technician notes for each top asset and look for the pattern. Then use a root cause analysis to find out why it keeps happening and fix the cause. Detailed notes from maintenance troubleshooting at the time of each failure make the pattern easier to see.
How to track it: number of repeat failures of the same type on the same asset.
3. Stop Failures Caused by the Repair Itself
Some failures are created during maintenance. A shaft is left slightly misaligned, a bolt is tightened to the wrong torque, dirt gets into a bearing housing or the wrong part is fitted. The equipment runs for a few days or weeks and then fails again.
This is more common than most teams expect. In the Nowlan and Heap reliability study of aircraft components, 68% of the items studied were most likely to fail shortly after installation or overhaul. Plant equipment is different, but the lesson carries over. Three habits reduce these failures:
- Count any failure within 30 days of a repair separately, so you can see how often it happens.
- Give technicians the procedure, torque values and alignment limits at the job, step by step, through digital work instructions.
- Have the correct parts ready at the job before work starts.
How to track it: first-time fix rate, meaning the share of repairs that do not need a second visit.
4. Catch Early Warning Signs on Operator Rounds
Equipment rarely fails without warning. It runs hotter, gets louder, vibrates more or starts to leak first. The time between the first warning sign and the breakdown is known as the P-F interval. A planned repair inside that window can still prevent the failure.
Operators walk past the equipment every shift, so their rounds are the lowest-cost early warning a plant has. Include your top assets in the rounds, set a normal range for each reading, and turn an abnormal reading into a maintenance request in the same shift. Operator rounds software helps by showing the limits at the point of reading.
Sensors for vibration, temperature or oil condition give earlier warning on critical equipment and support condition-based maintenance, but they depend on good records. In a 2024 S&P Global Market Intelligence survey of 345 manufacturing and industrial respondents, 51% named missing information as a challenge in moving toward predictive maintenance. Maintenance histories and spare parts locations were among the gaps.
How to track it: number of problems caught and fixed before failure each month.
5. Match Each Preventive Task to How the Asset Fails
Scheduled preventive maintenance works well for parts that wear out at a predictable rate, such as filters, belts and some seals. It does little for failures that can happen at any time, and those are the majority.
Review the preventive tasks on your top assets with that in mind, which is the purpose of preventive maintenance optimization:
- Keep scheduled replacement for parts with a known wear life.
- Use inspections and condition checks for failures that do not follow a schedule.
- Drop tasks that have not found a problem in years.
- Avoid opening up equipment that is running well. Unnecessary work can introduce new faults.
How to track it: failures per year on the assets where the tasks were changed.
Where Is Your Maintenance Budget Really Going?
Much of a breakdown’s cost never shows up on the work order: overtime, call-outs, rushed parts and planned jobs pushed back. Get a practical guide to finding that cost and cutting it.
MTBF Limitations: What the Number Cannot Tell You
MTBF tracks failure frequency, but it is not a complete measure of asset reliability. Keep three limitations in mind when using it to make maintenance decisions.
1. MTBF Does Not Explain the Failure Pattern
MTBF gives an average, not the failure pattern. Failures may occur early after installation, at random during operation, or more often as equipment wears. Reliability engineers sometimes describe these stages with a bathtub curve. If failure risk rises with age, a Weibull analysis can help examine the trend.
The maintenance task should match the failure mode. A scheduled overhaul may help a part with a known wear-out pattern, but it may not prevent a random failure.
2. MTBF Is Not the Expected Life of an Asset
An MTBF of 2,000 hours does not mean the asset will run for 2,000 hours before its next failure. It is an average; actual intervals may be shorter or longer.
A fleet average can hide individual assets that fail more often. Review the trend by asset and compare equipment doing similar work.
3. MTBF Alone Should Not Set a PM Interval
Do not schedule PM at a fixed percentage of MTBF without checking the failure pattern. For age-related wear, use the point at which failure risk begins to rise. For other failure modes, consider condition checks, operating changes, or a design change. Choosing each task by how the equipment actually fails is the core idea of reliability centered maintenance.
Use MTBF with failure-mode analysis, MTTR, availability, asset criticality, and downtime cost. It should inform the maintenance decision, not make it on its own.
How Innovapptive Helps Maintenance Teams Improve MTBF
Innovapptive Mobile Maintenance Management Software, iMaintenance connects work at the asset with the work orders, asset history, and records held in the plant's enterprise systems. It provides a mobile execution layer across SAP PM, IBM Maximo, and Oracle, so teams can work with the systems already in place. iMaintenance is part of Innovapptive's connected worker platform, which Frost & Sullivan named its 2026 Company of the Year for global augmented connected worker platforms.
Innovapptive acts as the industrial execution layer with the ERP or EAM remaining the system of record. iMaintenance does not replace it or monitor asset condition to predict failures. It helps teams capture issues, prepare and execute work, and return completion data to the system of record.
Capture Failure Information at the Asset
WorkSmartAI lets a technician report an issue by photo, voice note, or prompt. It can identify the equipment or functional location and structure the issue as a work request. At closeout, labor, parts, measurements, and technical details can be sent back to the ERP, supporting the failure history used in MTBF analysis.
Give Teams the Asset Context They Need
Asset 360 brings asset history, recent issues, measurements, and failure context into the workflow. Teams can review repeat problems at the equipment level instead of relying only on a fleet average.
Turn Operator Readings Into Action
Digital operator rounds record readings against the relevant equipment. When a reading crosses a defined limit, teams can raise an issue for follow-up rather than leave it in a paper log.
Support the Repair Through Completion
Technicians can access instructions, checklists, asset information, and work order details on a mobile device, including in areas with limited connectivity. RapidSync supports offline work and syncs completed information with the ERP when connectivity returns. Closeout can include actual hours, delay reasons, failure codes, and root cause.
Together, these capabilities help link issues to the right asset, prepare work before dispatch, guide execution, and capture the result for the next maintenance decision.
Get the Failure Records Your MTBF Depends On
See how maintenance teams capture every failure at the equipment, repair it right the first time and keep their ERP up to date, even offline.

Unlock Margins Hidden in Your Maintenance
Watch how leading manufacturers improve OEE, raise PM compliance and cut downtime through connected execution.
Request a Demo
2026 Company of the Year, Global Connected Worker Platforms
See why Frost & Sullivan recognized Innovapptive for closing the frontline execution gap.
Read the Report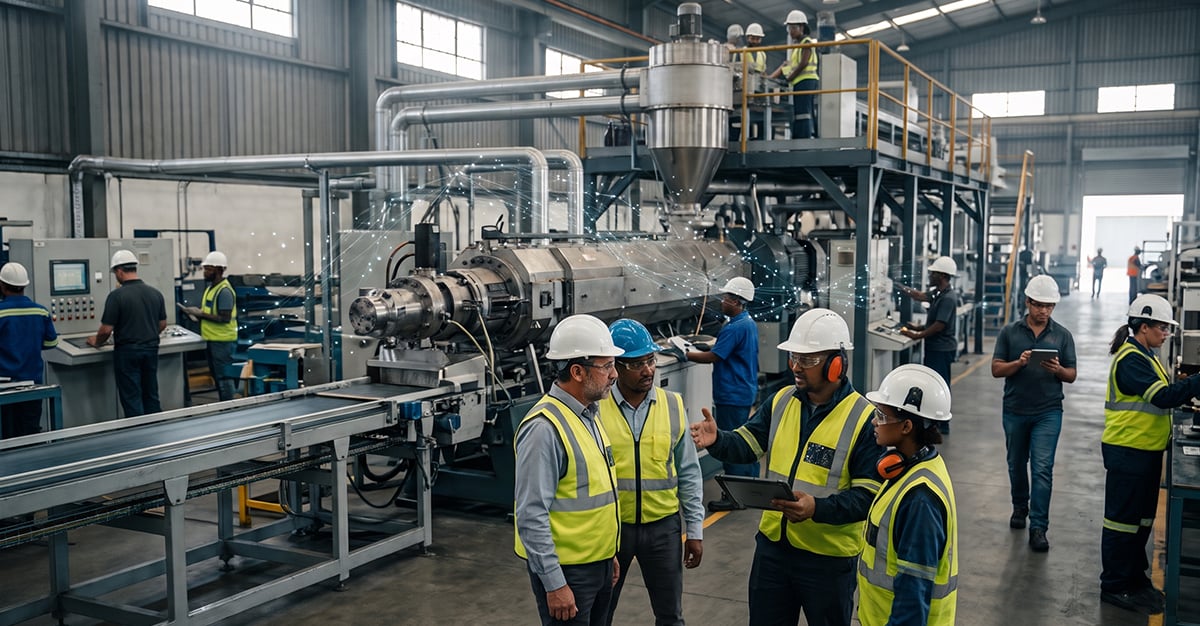
- 17-11-2026
Mean Time Between Failures (MTBF): Formula and Benchmarks
Mean time between failures (MTBF) tells you how long a piece of equipment typically runs before it...
- 05-11-2026
Unplanned Maintenance: Definition, Types, Plant Examples
Unplanned maintenance is repair work that has to start as soon as a failure or defect appears. It...

- 30-10-2026
Schedule Compliance: Formula, the 85% Benchmark and Fixes
Schedule compliance measures how much of a committed maintenance schedule gets completed as...